
Econ 101 says that when you have an excess supply of a thing relative to the demand for it, the thing’s price will decline.
Of course the 2008 housing crisis was a multifaceted phenomenon, yet this 2001 to mid-2008 simple chart showing the supply of existing homes for sale relative to the monthly sales pace (months supply in inventory), by itself, speaks volumes:

Here’s the chart to-date:
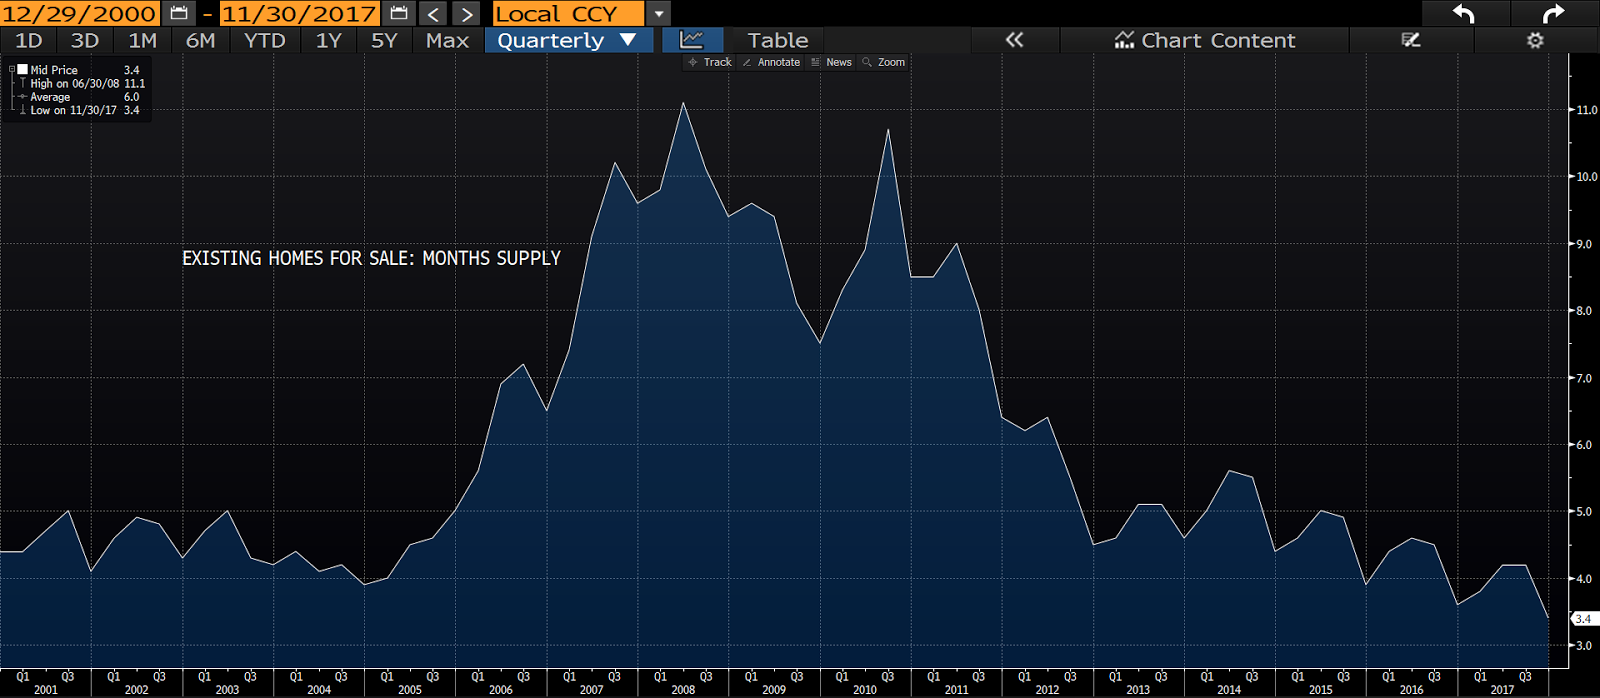
So if you’ve been worrying that we’re on the verge of a great bursting of a yet another housing bubble — by nature of the impressive rebound in pricing (as the growth in demand has outpaced supply) — feel free to move on to something more pressing…
