Of course he wasn’t alone in that thinking. I recall the day the S&P hit its new high, one of CNBC’s favored tech analysts told viewers to sell the market. While today we’re finally putting those May 2015 levels to the test (as I’ve been suggesting [in my videos] we likely would), his advice was delivered back in early July — an eternity ago to a short-term trader; meaning, those who shorted or bought puts based on the technical guru’s assessment likely took it in the shorts…
But — particularly for us long-term investors — what about this notion that all-time highs have to mean lower levels are a coming? Here’s Ben Carson with the numbers:
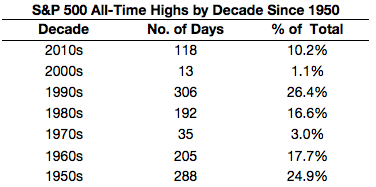
If we look at daily pricing data going back to 1950, what you see is a ton of new all-time highs in stocks. Here are the numbers broken out by decade:
Some decades have been better than others, but you can see that all-time highs happen fairly frequently. Nearly 7% of all market trading days have seen new all-time highs since 1950.There are definitely decades where new highs tend to cluster together more than others. There were also some lengthy droughts following bear markets where a new high wasn’t seen for some time. There was a seven and a half year period from 1973 to 1980 and another seven plus year period from 2000 to 2007 that the S&P 500 went without seeing new highs. So it’s not like these things work on a set schedule.
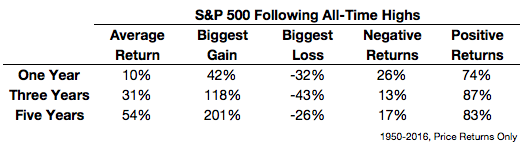
It’s also helpful to see how stocks have performed, on average, following historical all-time highs in this period:
The average returns following an all-time high one, three and five years out into the future have been similar to the average gains over this entire period. And stock market returns have been positive the majority of the time when you look ahead over all three time frames. Basically, all-time highs are a natural part of a stock market that has mostly gone up over time. Most of the time markets continue to rise from all-time highs.