While the economy and the stock market do not necessarily move in lockstep — we’ve had up years during recessions and down years during expansions — we can all agree that, over the long-run, a healthy economy is essential to a healthy stock market.
Here’s a look at the U.S. (although many, if not all, have global implications) economic indicators I track and record each week (there are more, but these are the ones I take the trouble to formally document for myself). The color coded titles denote my view of the signal each is presently sending. The red-shaded areas in the charts highlight past recessions: click each chart to enlarge…
CONSUMER
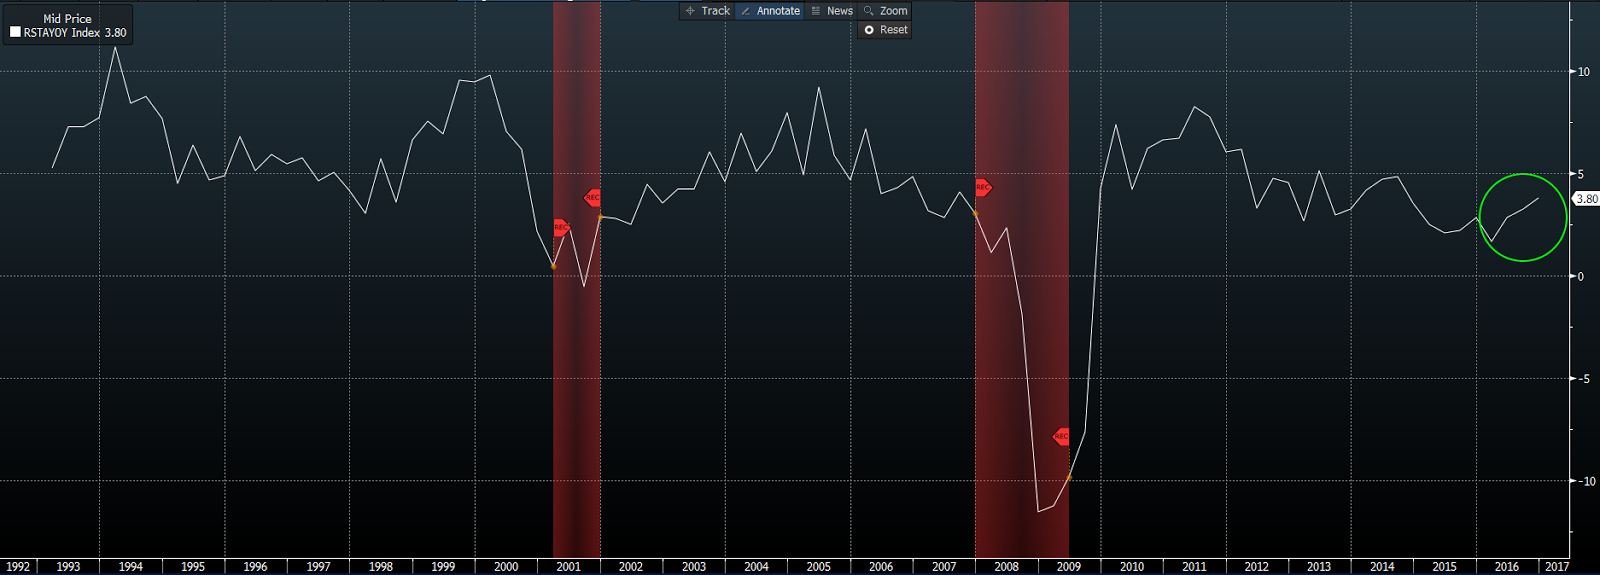
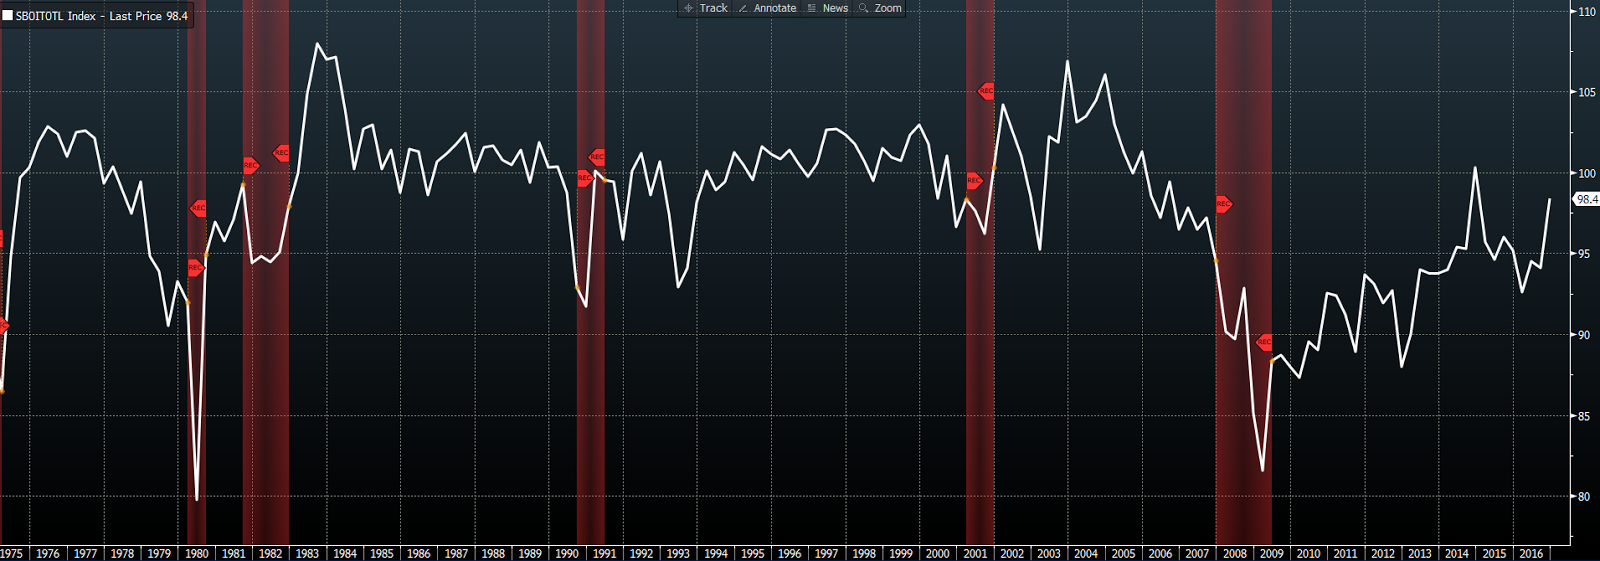
RETAIL
SALES, Brick and Mortar:
After an initial post-recession surge that saw retail sales increasing into 2011, the trend has been lower. Since March of this year, however, sales have been encouraging amid better labor data.
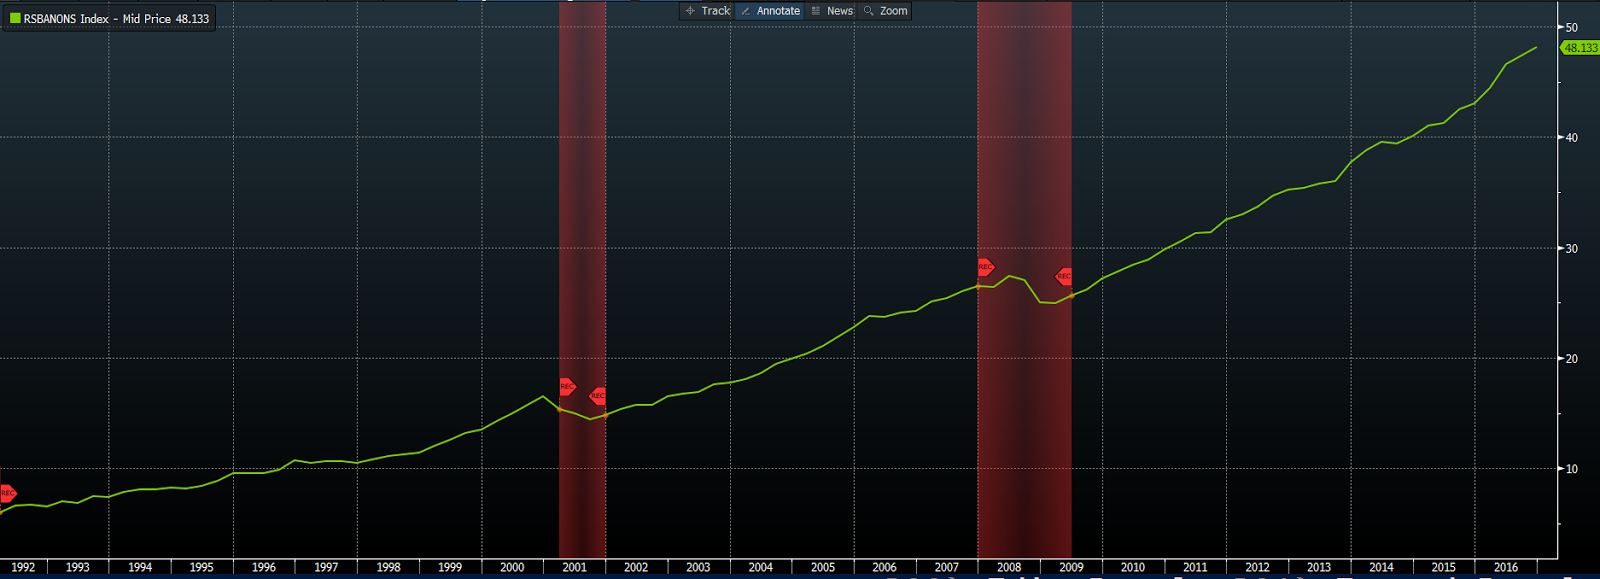
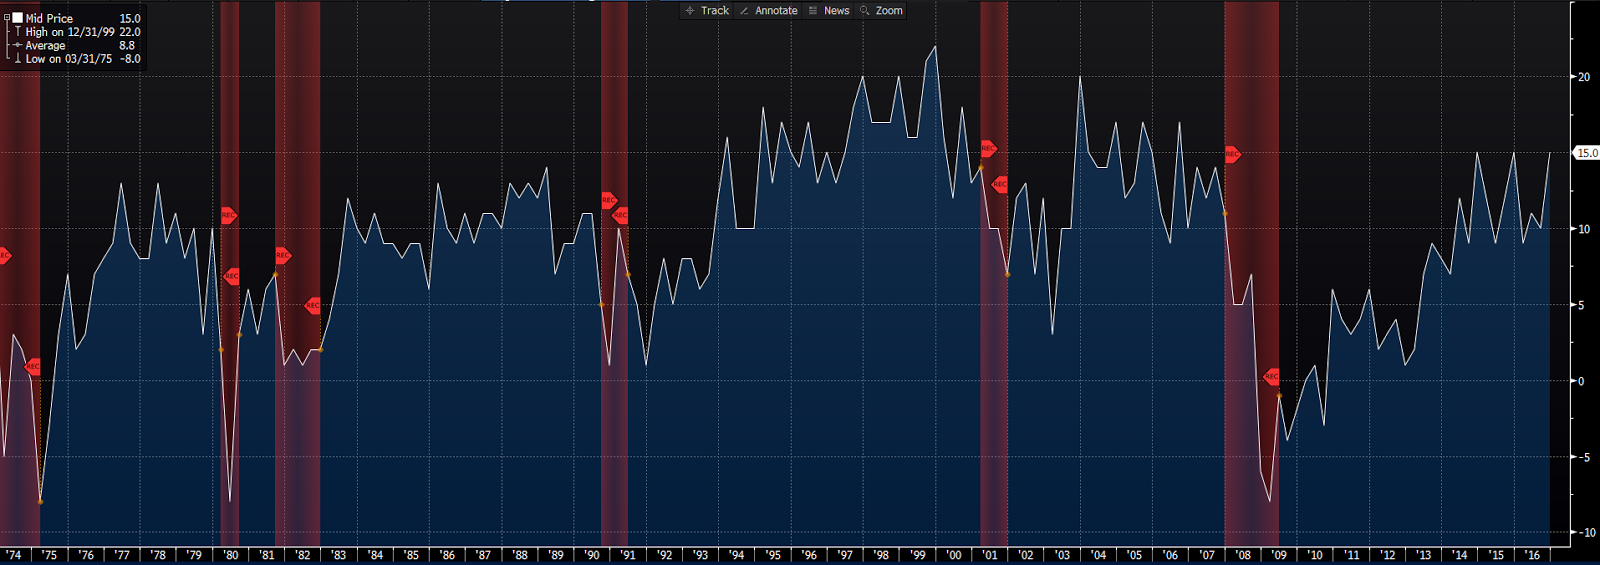
ONLINE
RETAIL
Clearly, any weakness in brick and mortar retail can be partly, if not largely, explained by the steady growth in online sales.
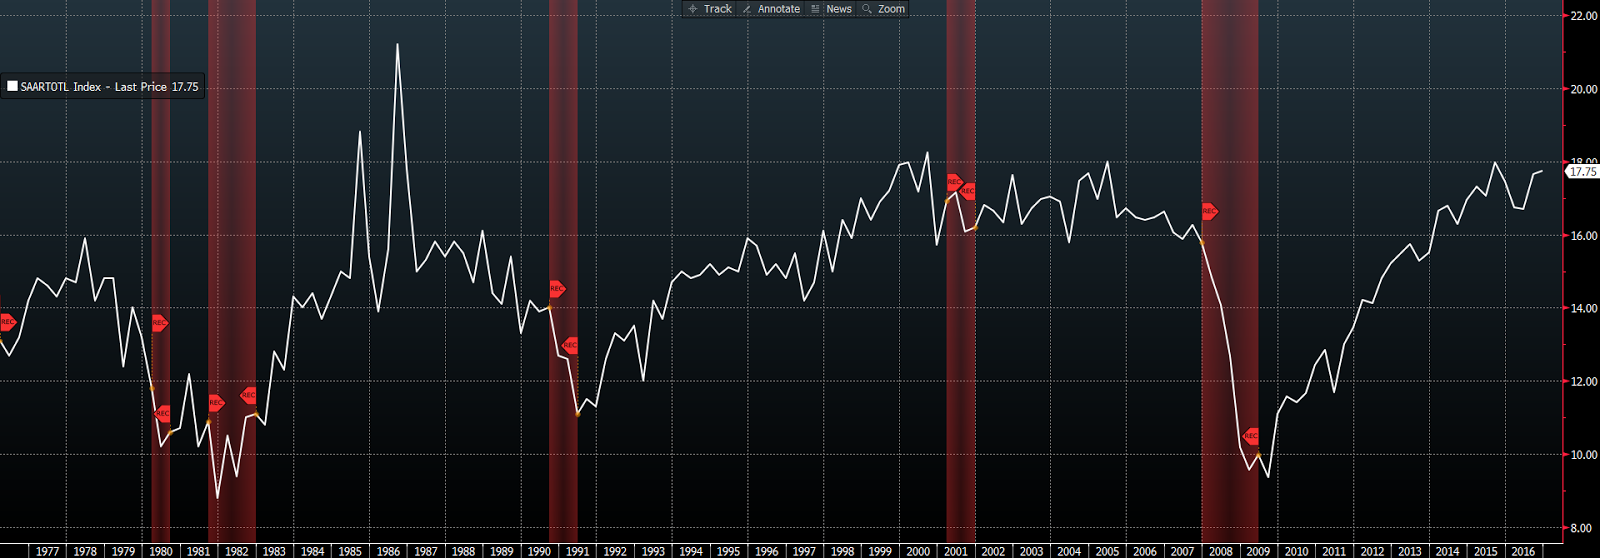
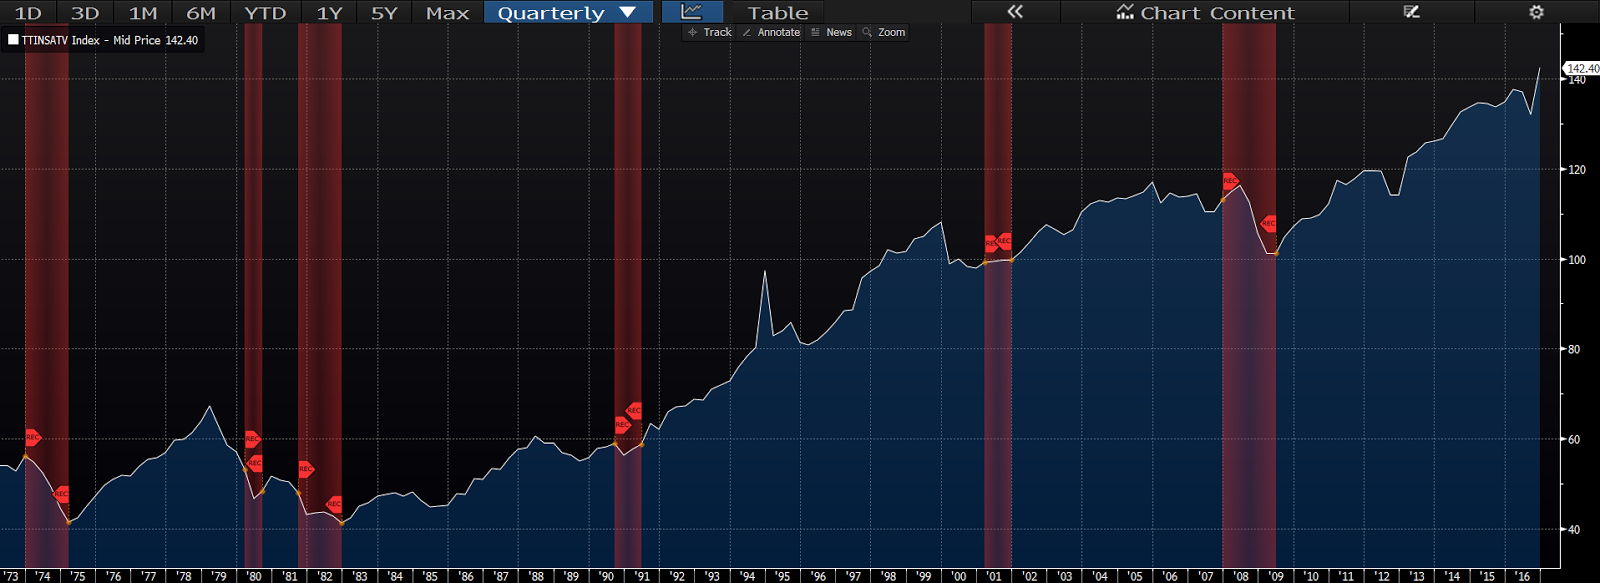
AUTO SALES
Noisy, as always, but still hovering at record levels. Consumer confidence and a strong labor market bodes well for auto sales going forward.
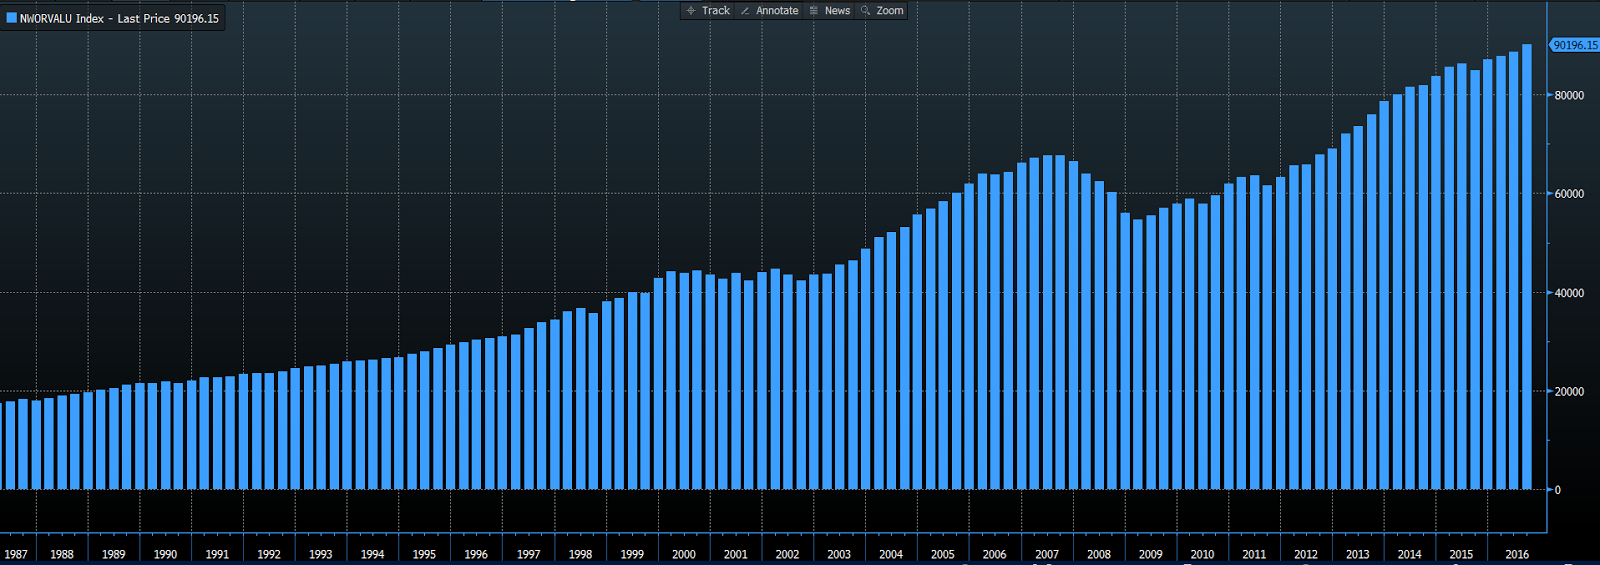
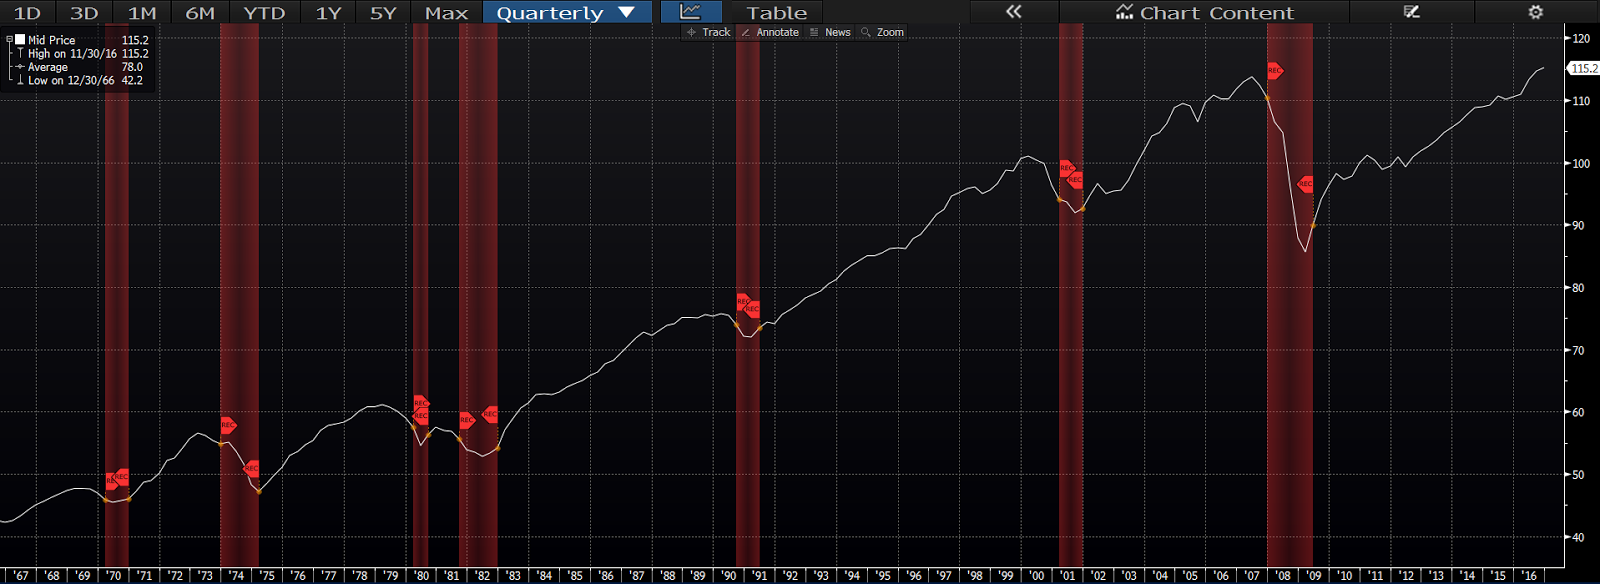
HOUSEHOLD
NET WORTH:
The U.S. Household is wealthier than its ever been!
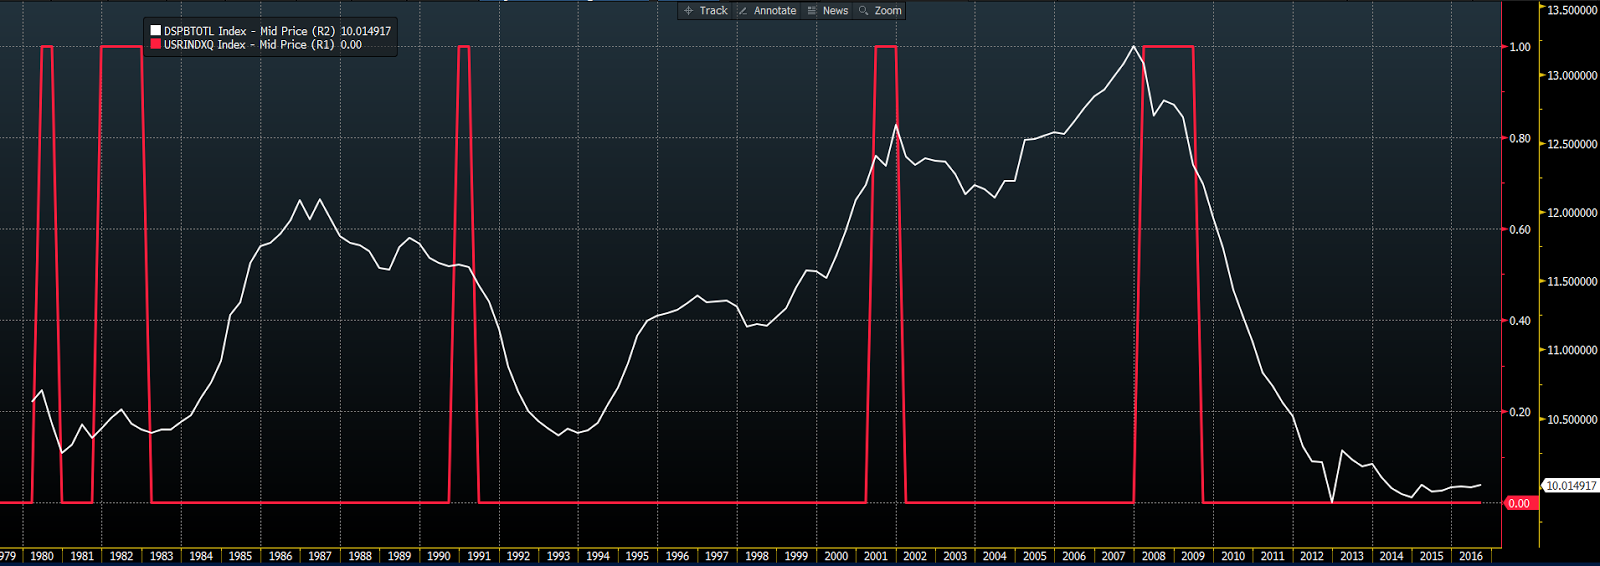
CONSUMER
DEBT SERVICE RATIO:
As good as it gets in terms of the consumers ratio of debt payments to disposable income!
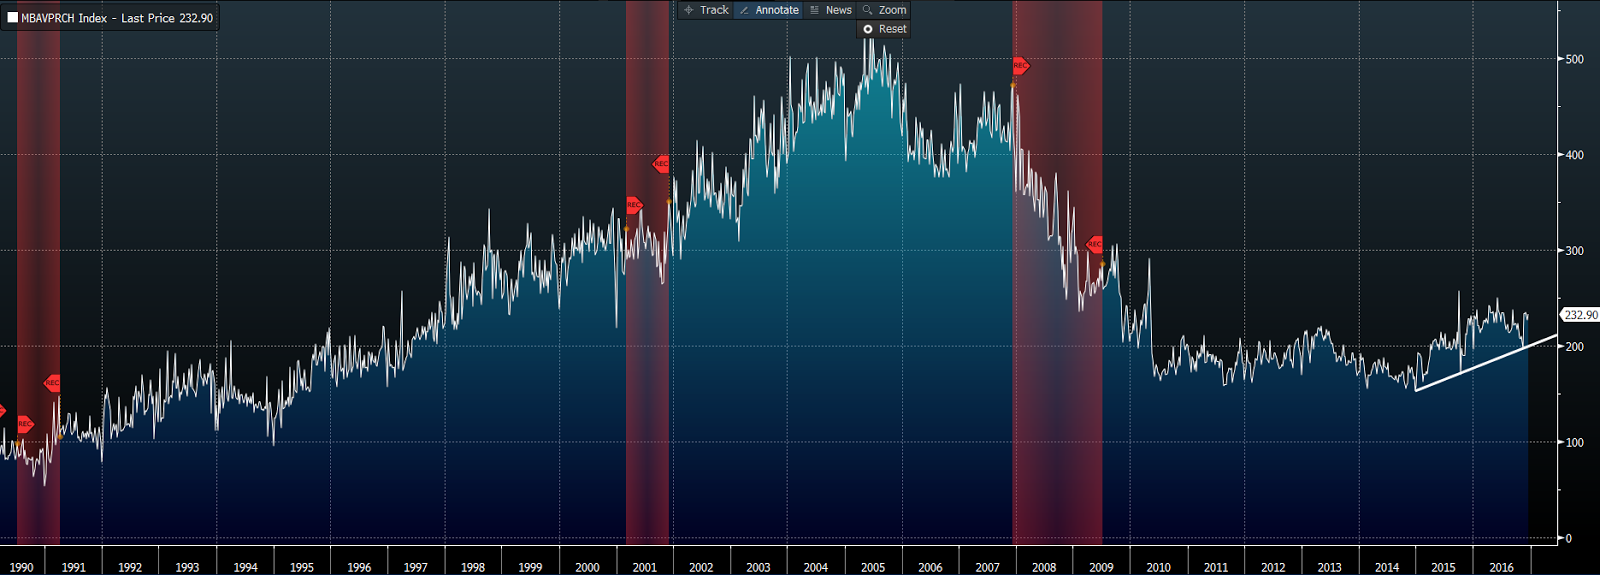
WEEKLY
MORTGAGE PURCHASE APPS:
Trending well. While higher rates are sure to pose a headwind, the strength of the consumer, favorable demographics, and a favorable overall economic outlook bodes well for the housing market going forward.
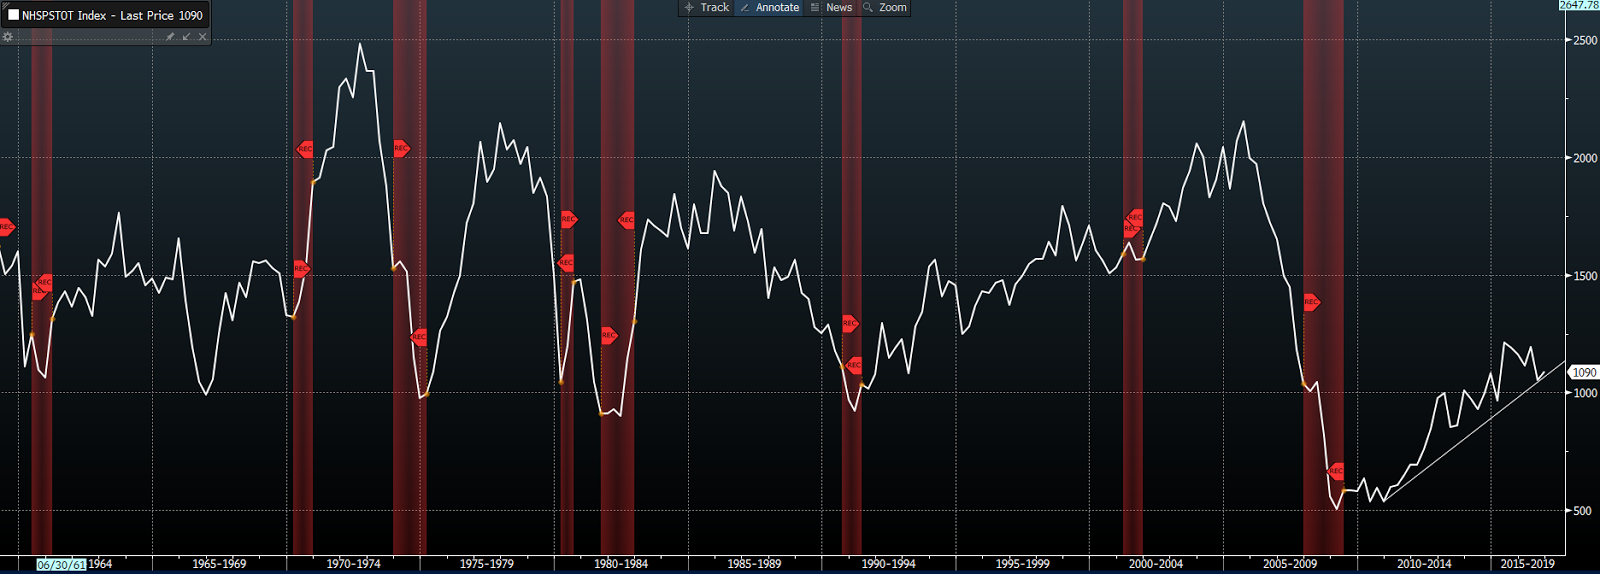
HOUSING
STARTS
Ditto Mortgage Apps.
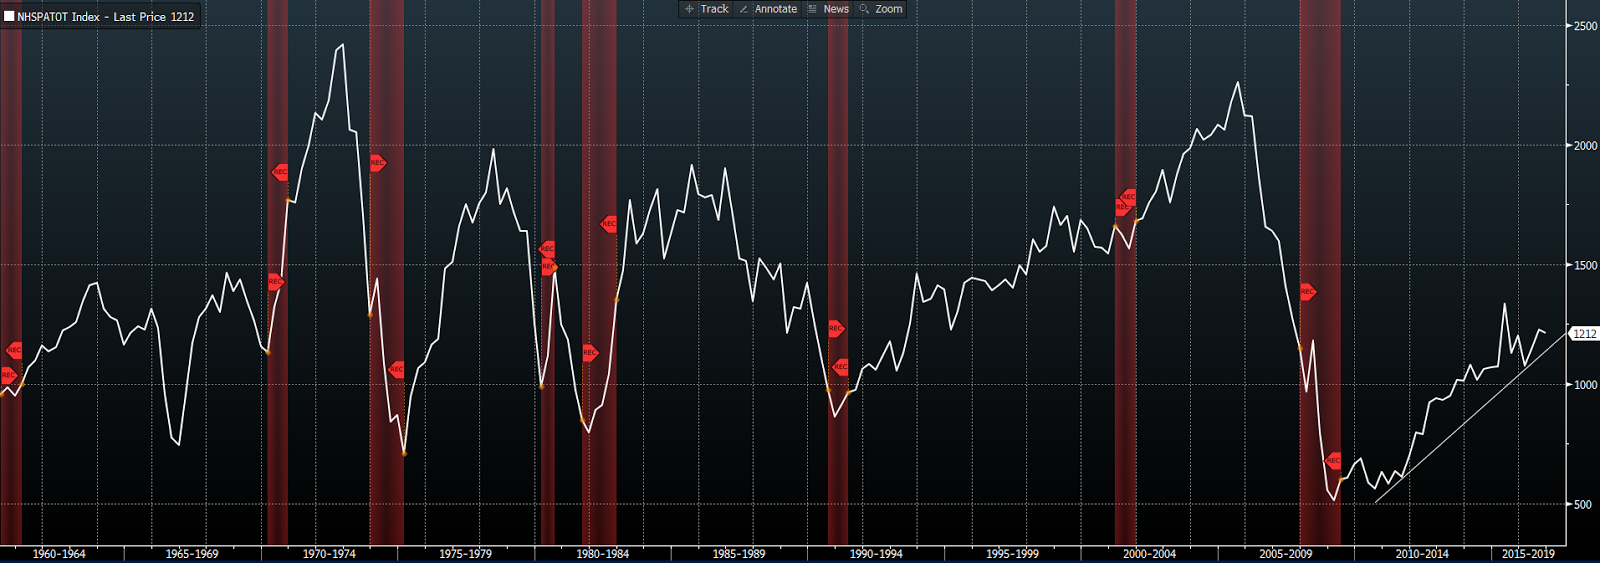
HOUSING PERMITS
Ditto.
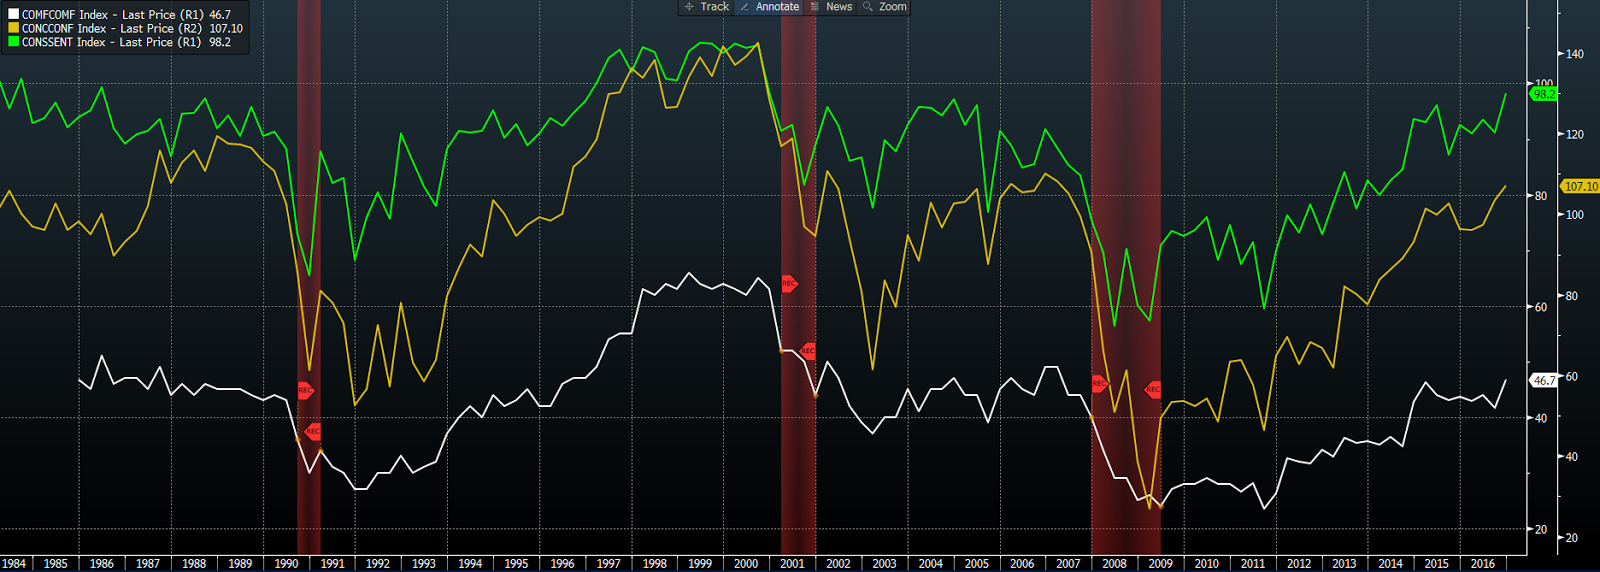
CONSUMER
CONFIDENCE
Consumer spending is 2/3rds of GDP, thus the increase in optimism speaks well of the economy going forward.
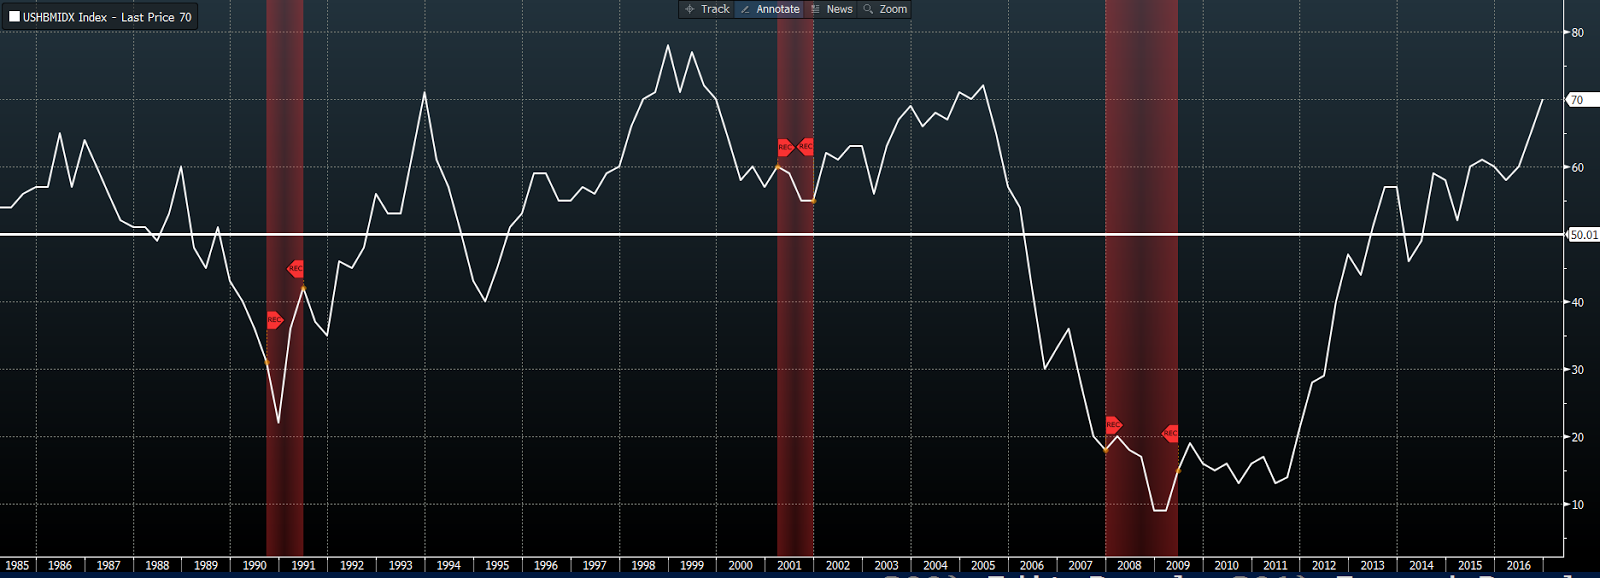
NAHB INDEX
Monthly, the National Association of Home Builders surveys some 400+ builders. The NAHB’s aim is to gauge sentiment among the country’s single-family housing contractors. Above 50 denotes optimism. The current 70 is an historically high number and sends a strong signal about housing going forward.
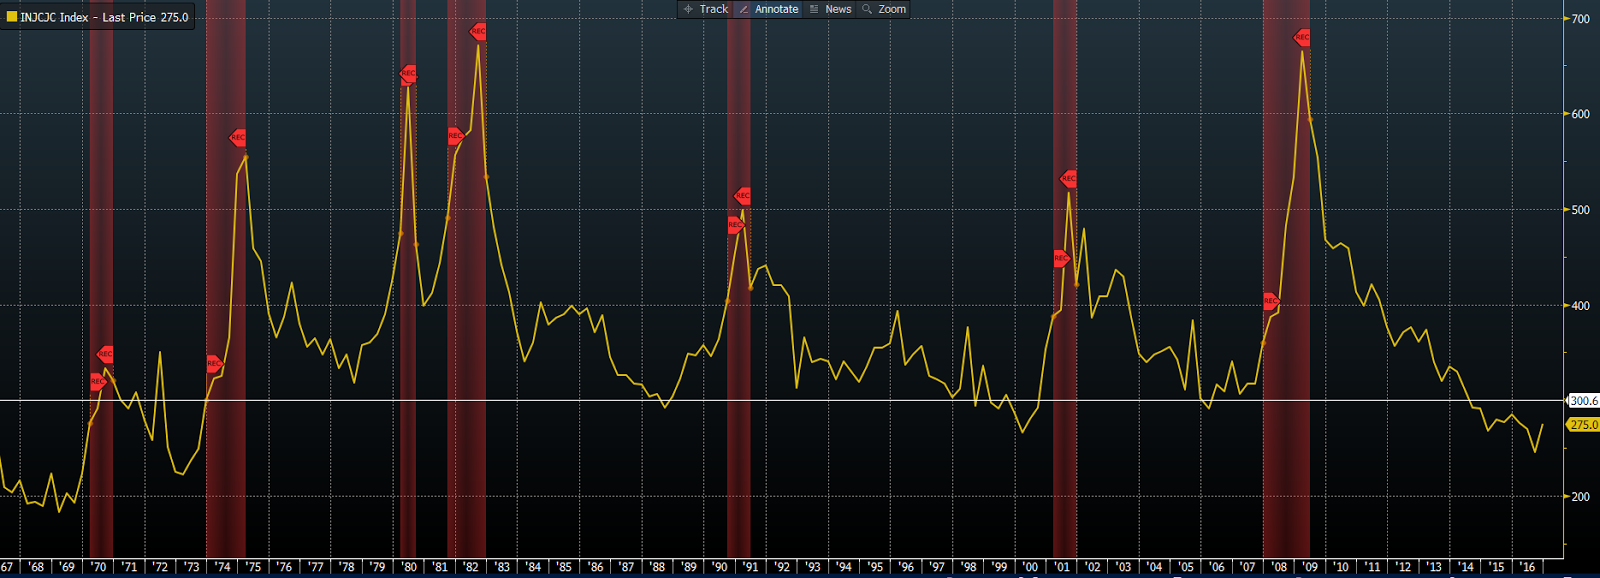
WEEKLY
JOBLESS CLAIMS:
Sub-300k for months… Best readings since the ’70s! Needless to say, such consistently strong readings speak optimistically of the labor market and, thus, the economy going forward.
BUSINESS
INVENTORY
TO SALES RATIO:
After a disturbingly higher trend the past few years, this indicator has improved in 2016. (Low inventories to sales is what you look for, as such a scenario —in an expanding economy — requires increased future production).
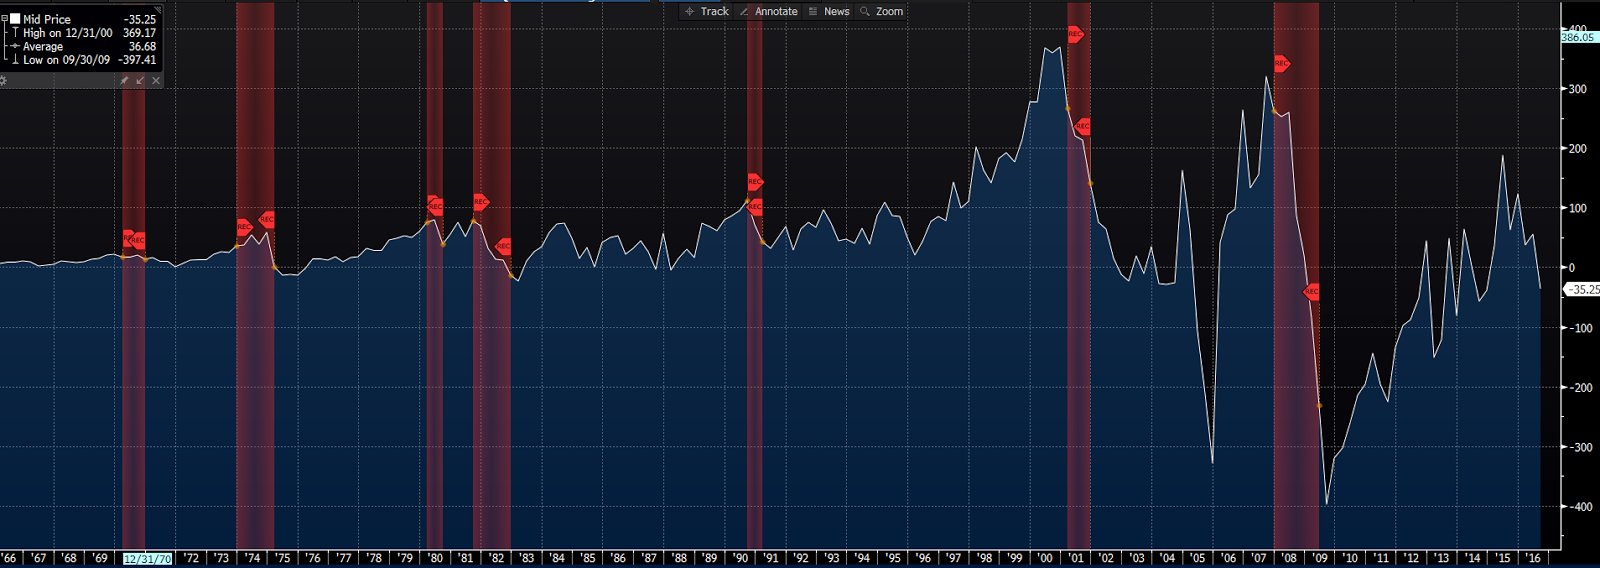
CORPORATE
FINANCING GAP
The Corporate Financing Gap compares corporate capital outlays with savings outlays and cash-flow rates). This indicator is trending quite nicely this year (downtrend = growing resources relative to capital investment) and speaks to a potential, and long overdue, pick up in business expansion.
CORPORATE
AND INDUSTRIAL LOANS
C&I loans indicate the extent to which companies are willing to finance future expansions. The present trend is encouraging.
COMMERCIAL
PAPER ISSUANCE:
This one contradicts other readings. A decline in commercial paper issuance suggests reduced short-term capital needs. Typically this would increase during an economic expansion. One to keep an eye on!
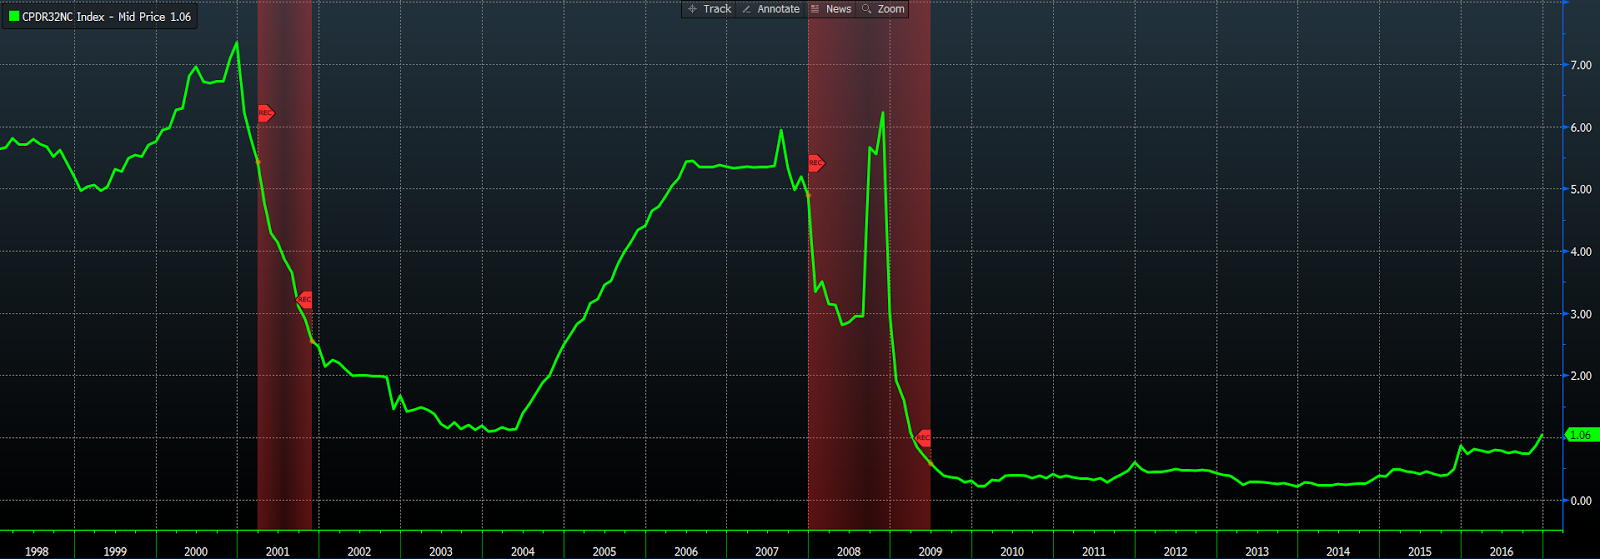
COMMERCIAL
PAPER RATES:
Historically low, although trending higher. A widening gap (with comm ppr rates higher) between commercial paper rates and the Fed funds rate can be a signal that credit conditions are tightening. The present rise, however, doesn’t create an alarming gap (particularly given the recent hike in the fed funds target rate) and appears to be more about expectations of a faster growing economy and attendant higher interest rates.
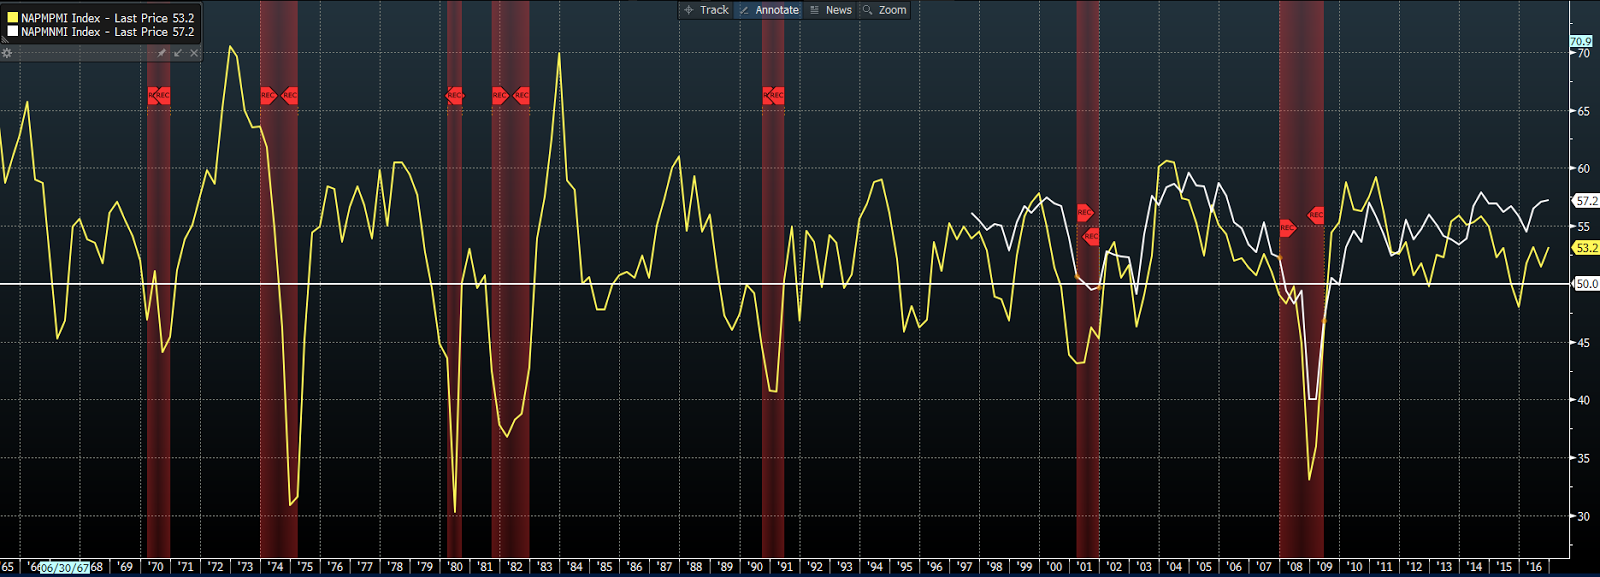
THE ISM SURVEYS: Services /Manufacturing
The ISM surveys of sentiment among the nation’s purchasing managers are among the most important indicators of the health of the U.S. economy. Above 50 denotes expansion. The recent trend speaks optimistically going forward.
NFIB SMALL
BUSINESS OPTIMISM INDEX:
Small businesses produce nearly 2/3rds of all jobs in the U.S.. Therefore, it’s important to understand how small business owners view their prospects going forward. Huge positive surge in November!
NFIB HIRING PLANS INDEX
Big jump in hiring plans in November!
NFIB CAPITAL EXPENDITURE PLANS
INDEX
The post-recession trend has been positive. However, capex (physical expansion/new equipment purchases) plans didn’t increase with optimism and hiring plans in November.
TRUCK TONNAGE
Trucks moving more stuff speaks very positively about the economy.
CHEMICAL ACTIVITY INDEX
Chemicals occupy an early position in the supply chain. Therefore, chemical industry data makes for a very good leading indicator of economic activity. Very positive look currently!
INFLATION
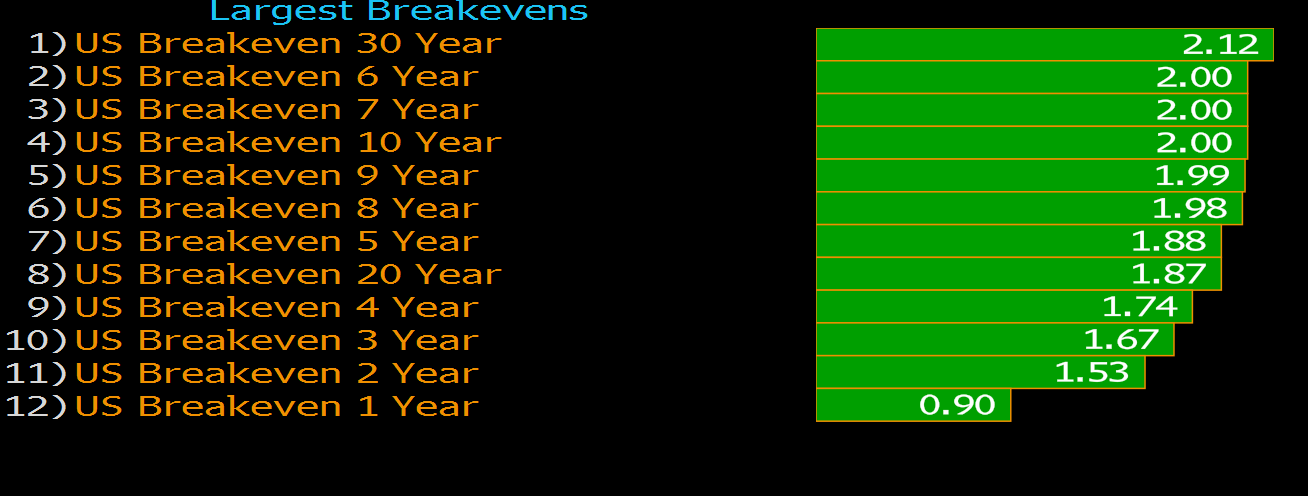
INFLATION BREAKEVENS (TIP SPREADS)
TIP (treasury inflation protected security) spreads measure the difference between nominal treasury debt yields and those of inflation linked bonds. The greater the spread the greater the inflation expectation.Spreads have been on the rise, denoting potentially higher inflation, which is not necessarily a bad thing at this phase of the cycle.
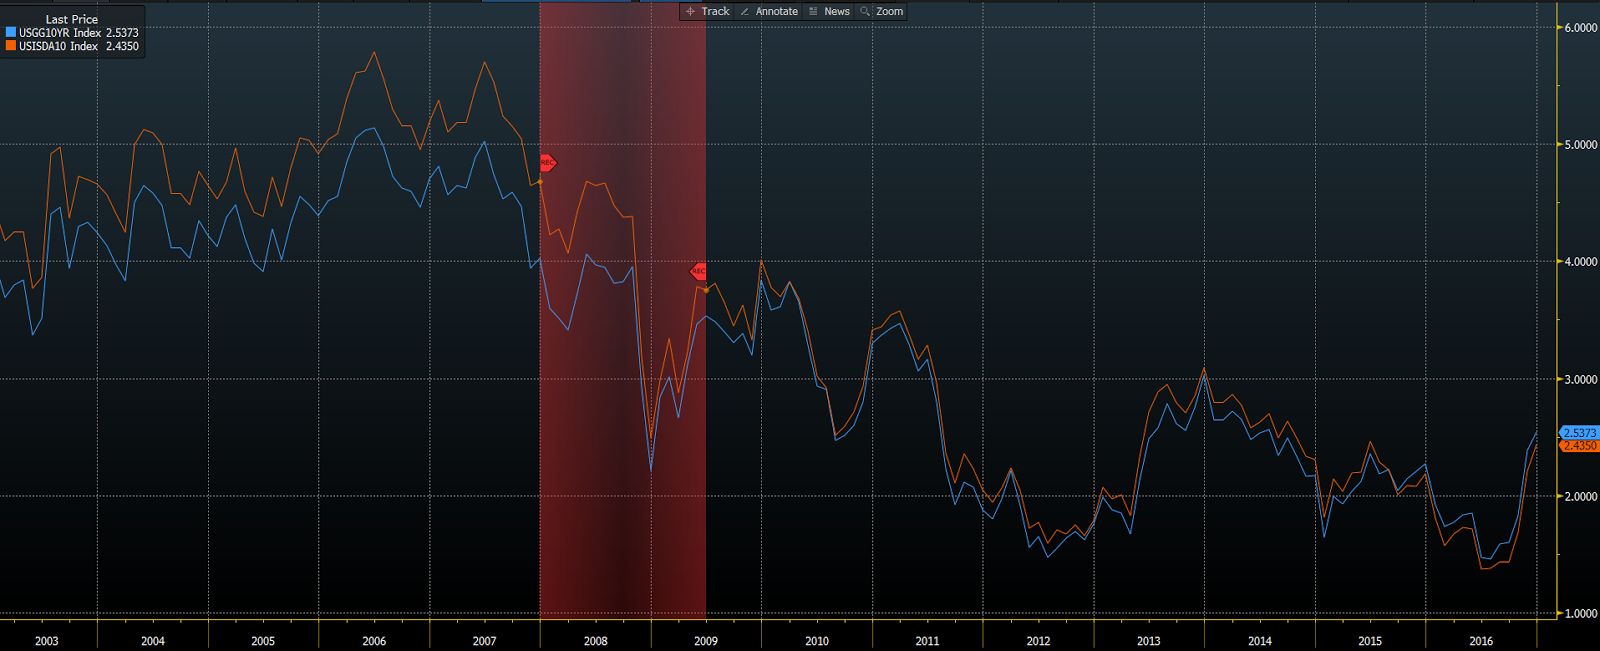
For further visual, here’s the chart of the 10-yr TIP spread:
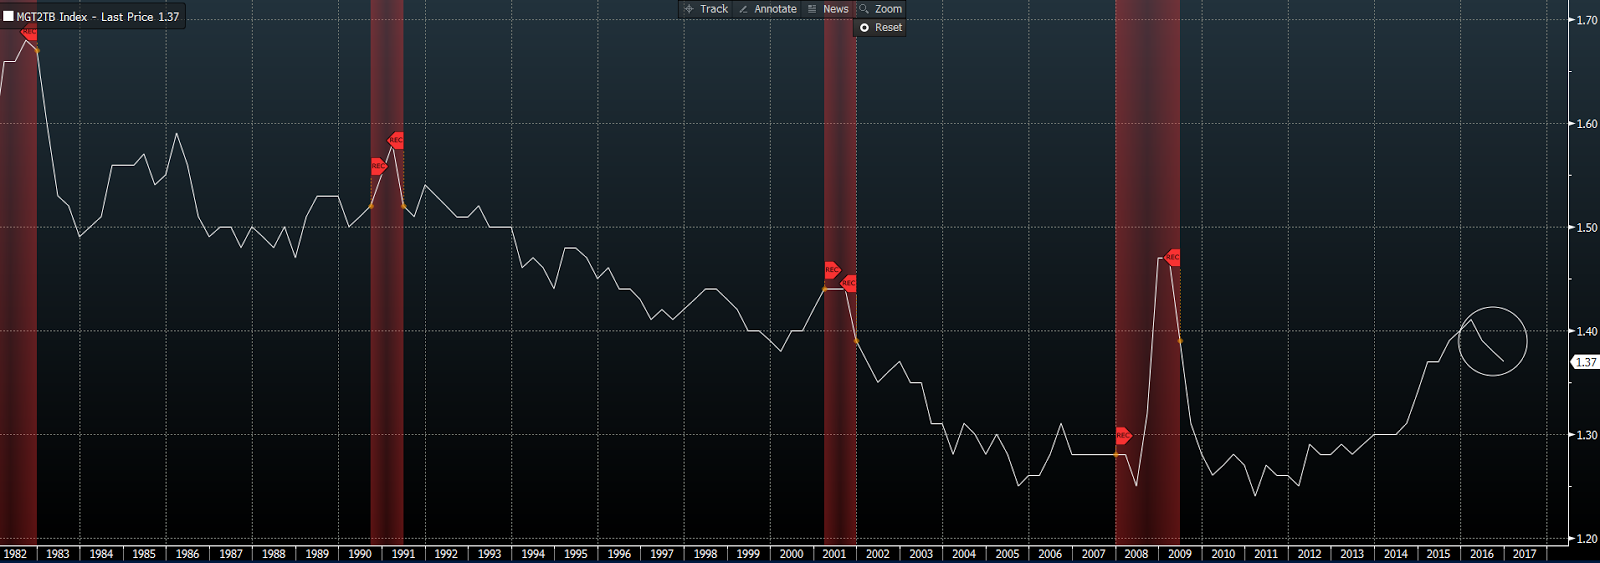
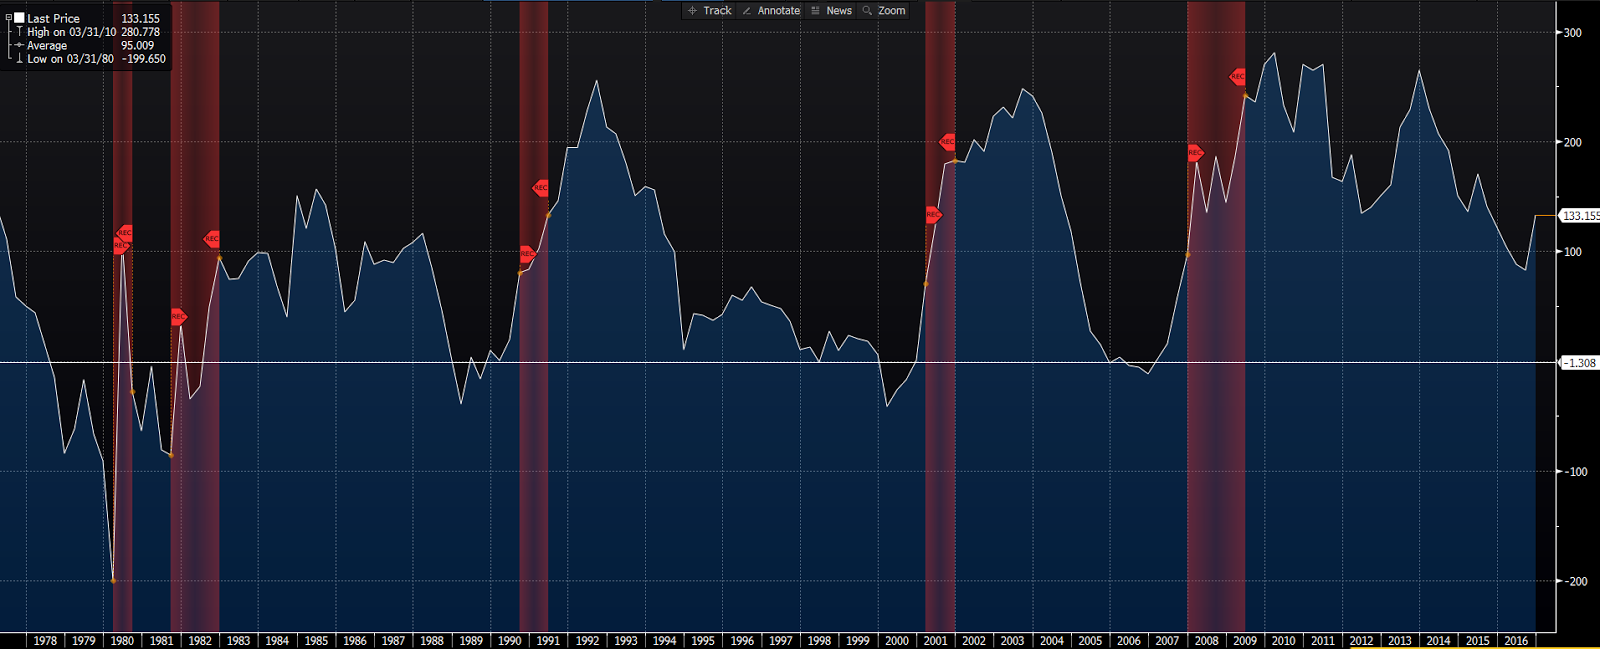
2-YEAR TREASURY/FED FUNDS SPREAD
Tight correlation between the 2-yr t-note and the fed funds rate makes the 2-yr an important indicator in terms of market/economic expectations. The present .23% spread denotes market expectations of economic growth and moderate inflation/fed policy going forward.
ECONOMIC STRESS
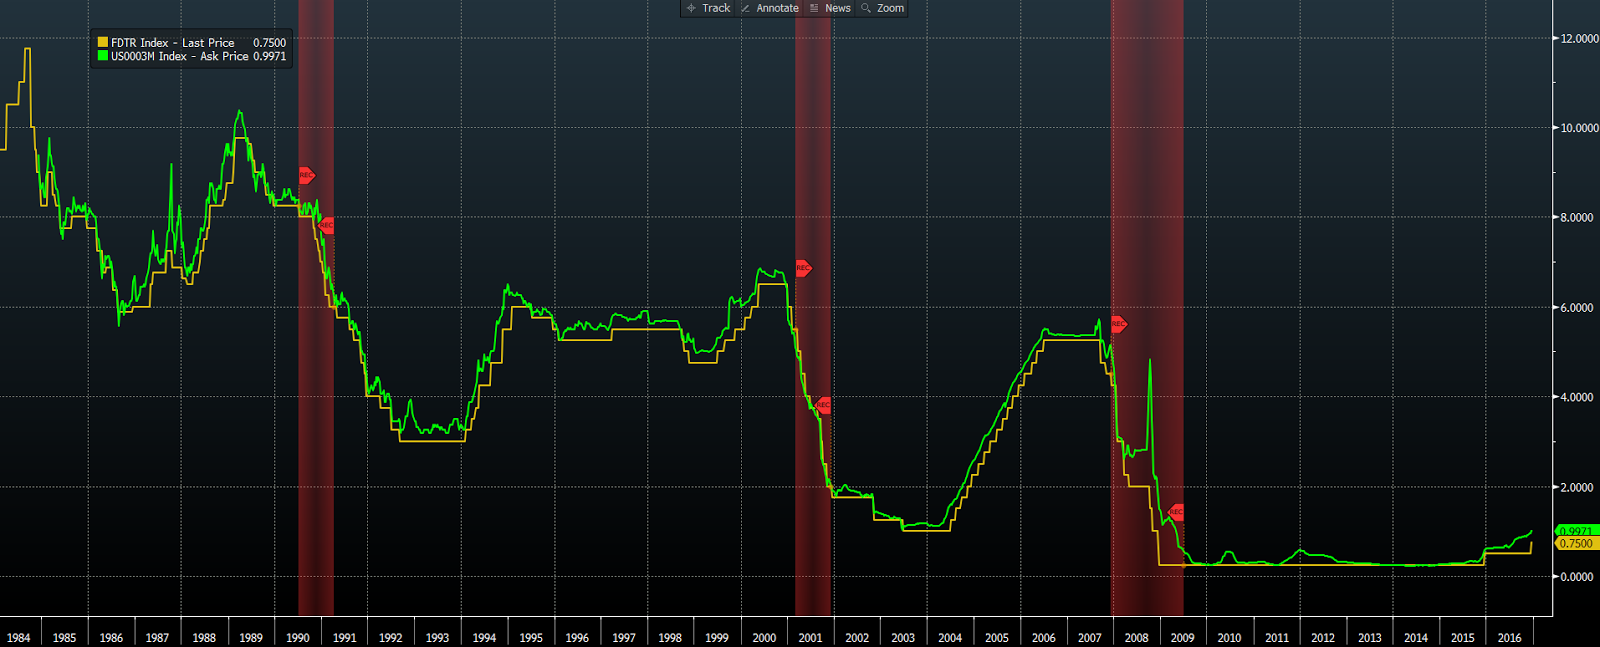
LIBOR/FED FUNDS SPREAD:
The cost of vast amounts of debt globally is tied to the LIBOR rate. The 3-month is tightly correlated to the fed funds rate. During periods of economic stress the spread widens as LIBOR rises in response to concerns regarding borrows’ credit worthiness. A slight widening has occurred recently, but not nearly at an alarming pace and resulting in a spread just slightly wider than the norm.
2s/10s
SPREAD:
Recessions almost never occur without the yield on the 10-year treasury bond dropping below that of the 2-year note (an inverted yield curve). The present spread denotes virtually zero odds of recession in the foreseeable future.
10-YEAR SWAP RATE
When variable rate debt holders fear rates will rise they may look to the swaps market to trade (swap) their variable rate for a fixed rate. The higher demand will push swap rates higher. The swap rate thus becomes a gauge of interest rate expectations and overall credit conditions. While rates have risen of late, the spread between the swap rate and the 10-yr treasury yield remains negative. Denoting a relatively healthy economic view, low to moderate inflation expectations and decent credit conditions going forward.
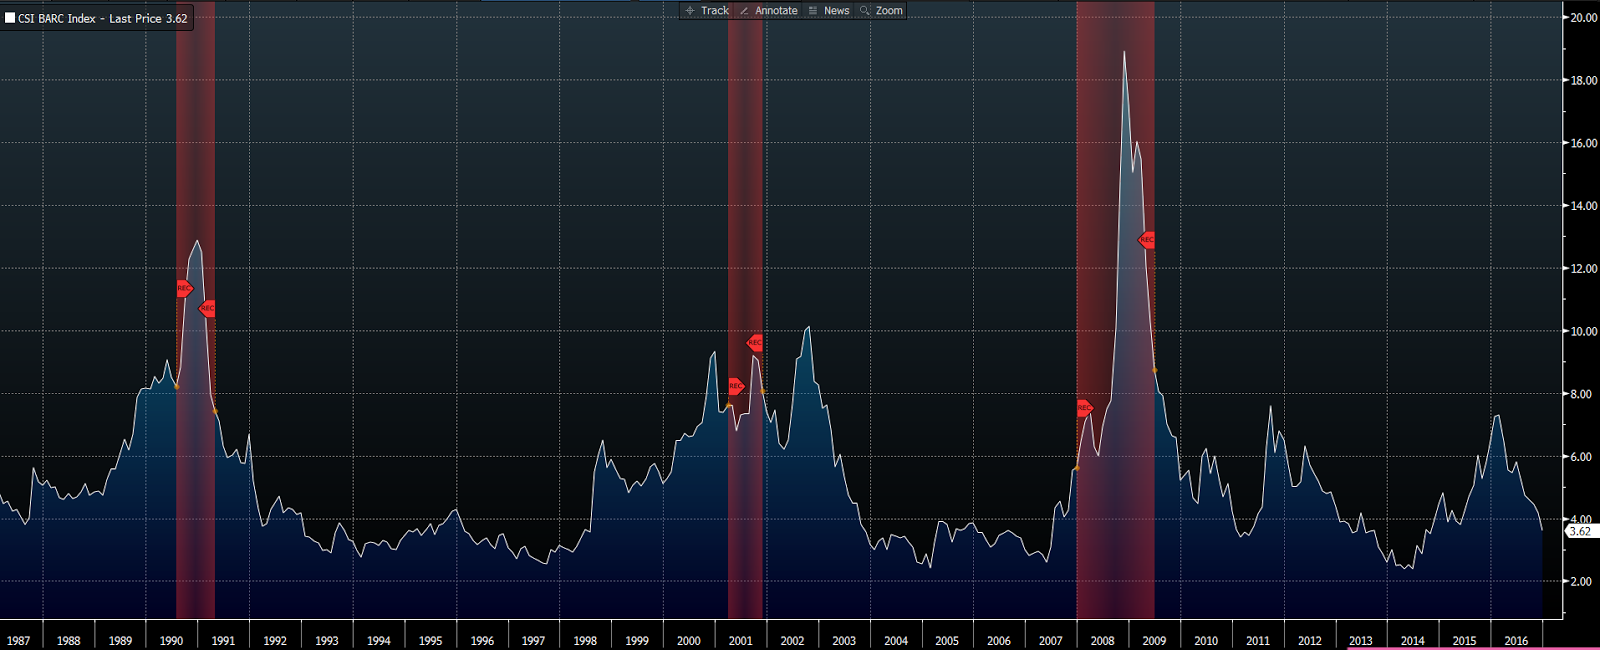
HIGH YIELD
CREDIT SPREAD:
The difference between the yield on high-yield (junk) bonds and treasury bonds is one of the best indicators of credit market conditions as well as the overall state of the economy. When the economy is suspect investors require higher returns from low-quality issuers of debt. They also buy treasuries under such circumstances, pushing treasury prices up and yields lower. The opposite occurs during good economic times: Investors are comfortable with the credit worthiness of lower-quality borrowers and thus bid their bond prices up and yields lower. They’re also less apt to invest in treasuries, forcing their prices down and yields higher. The present trend speaks very well of the economy and of current credit conditions!
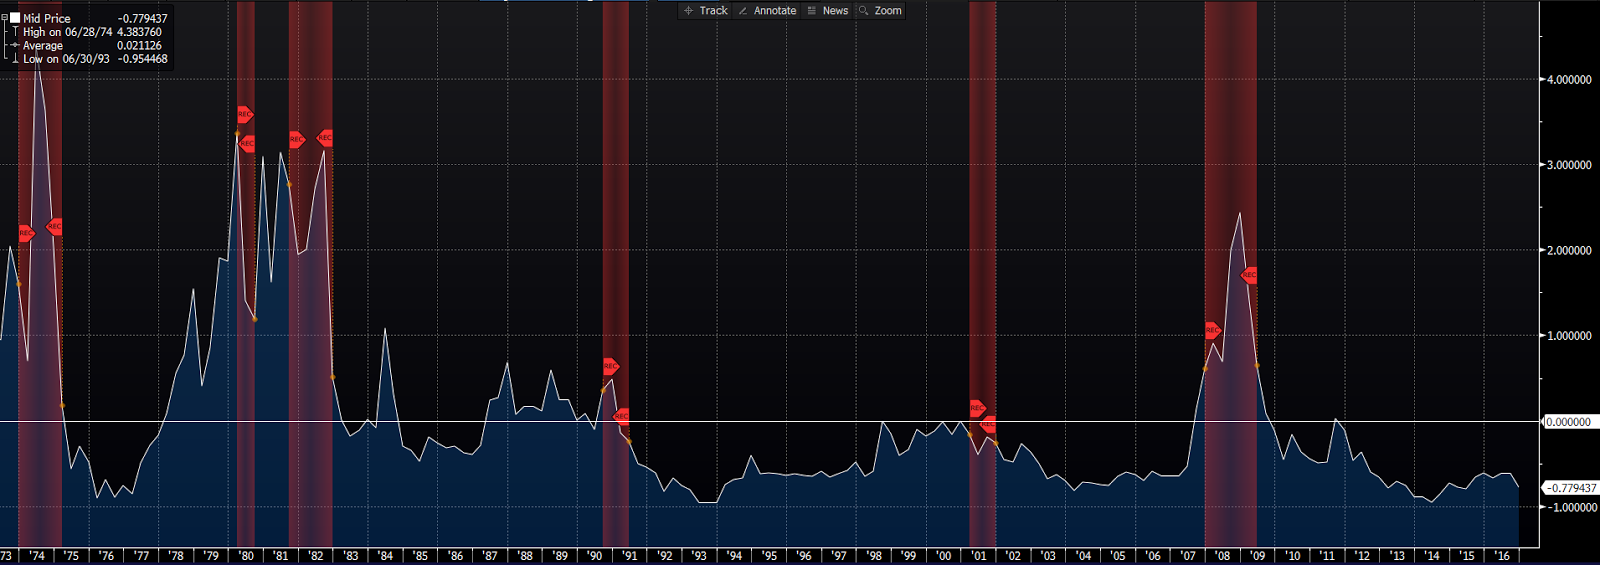
CHICAGO FED NATIONAL FINANCIAL CONDITIONS
INDEX
The NFCI tracks liquidity and leverage in debt and equity markets, as well as money markets and shadow banking systems to determine whether present financial conditions are tight(ening) or loose(ning). Positive values denote tight(ening) conditions. Clearly, present financial conditions are conducive to economic growth.
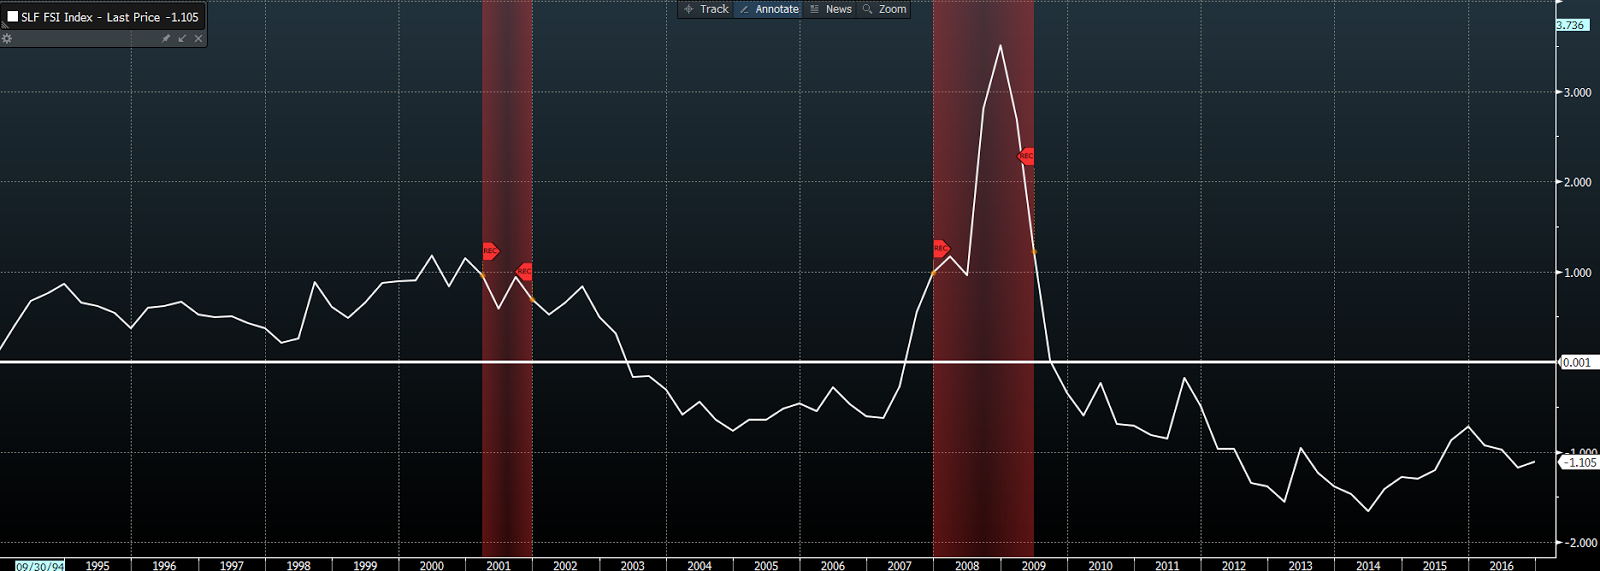
ST LOUIS FED FINANCIAL STRESS INDEX
The STLFSI tracks financial stress in the markets by assessing 18 weekly data series: 7 interest rate series, 6 yield spreads and five other series. Above zero denotes high stress in the system. Like the NFCI, this one sends a positive signal with regard to credit conditions and economic prospects going forward.
KANSAS CITY FED FINANCIAL STRESS
INDEX
The KCFSI measures stress in the U.S. financial system by tracking 11 financial market variables on a monthly basis. Values above zero denote above average stress in the system. While last month saw a slight uptick, the present level (below zero) of this stress indicator says good things about the present state of the economy.
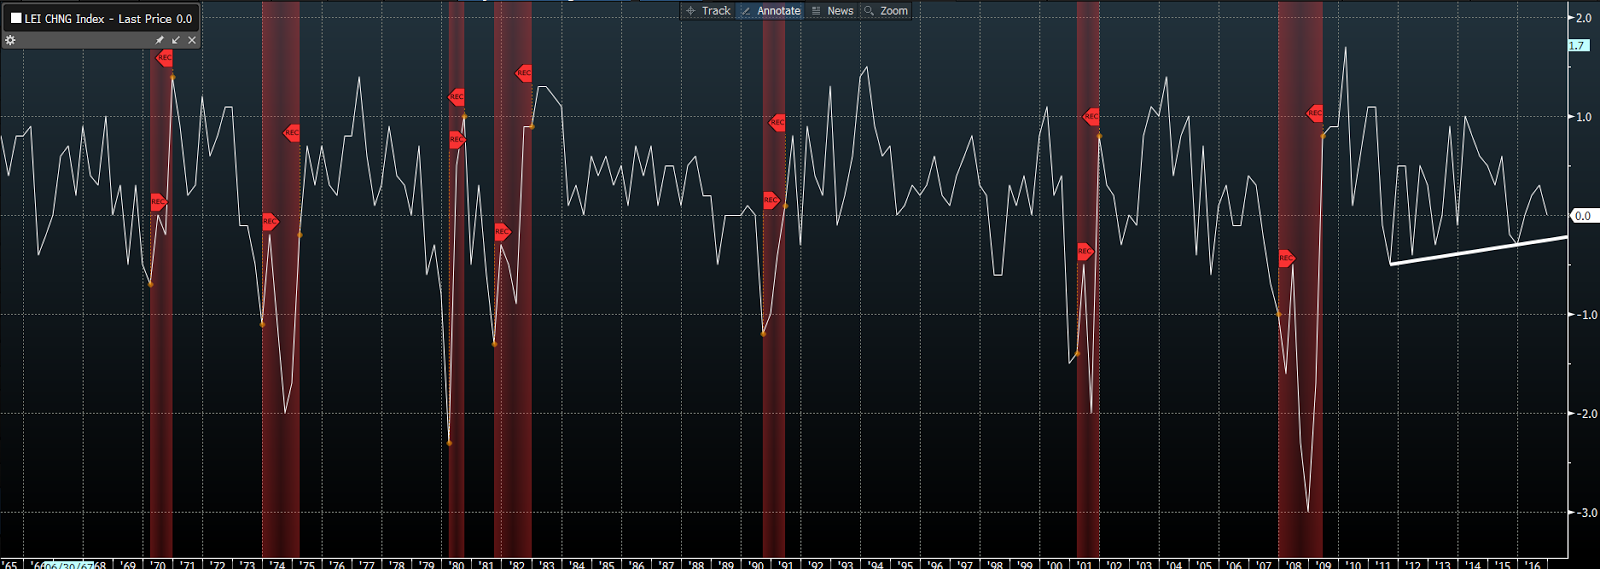
THE INDEX OF LEADING ECONOMIC
INDICATORS
The Conference Board’s LEI tracks 10 key variables — from labor data to data on consumer goods, materials, manufacturers’ shipments, capital goods, building permits, the ISMs, sentiment, and the stock market — in an effort to forecast future economic activity. While forever a noisy indicator, the present trend remains higher, although last month’s reading ticked lower.
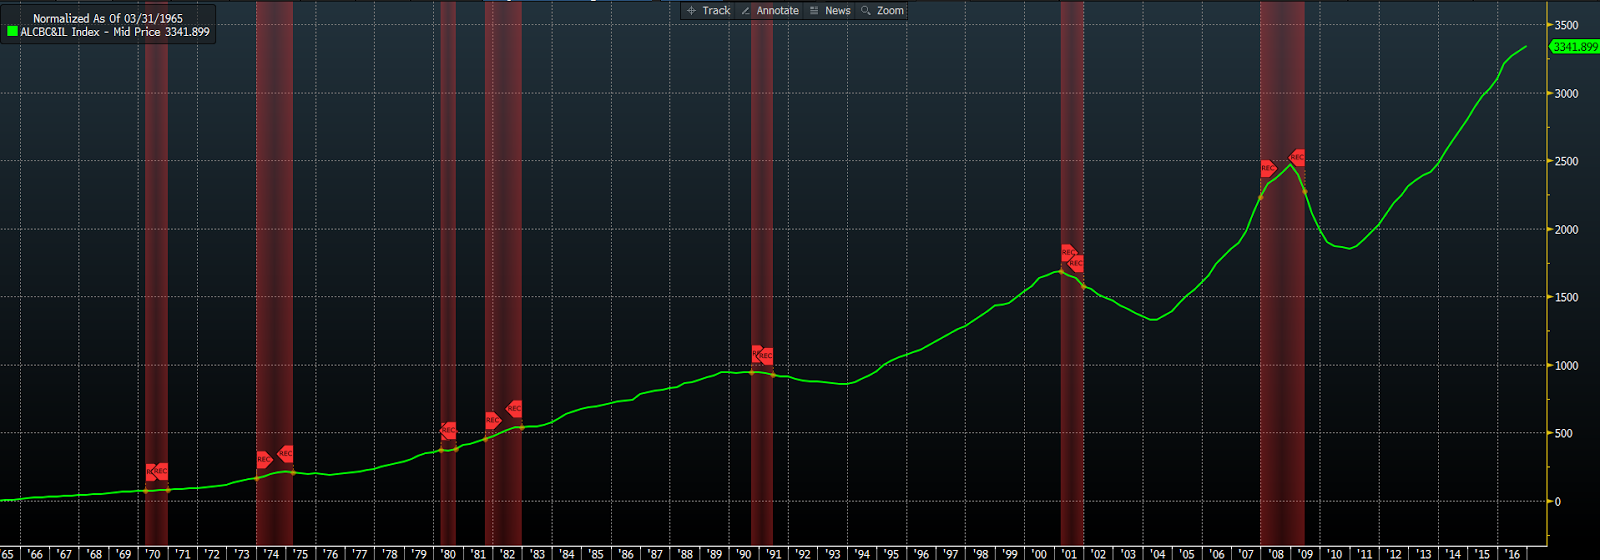
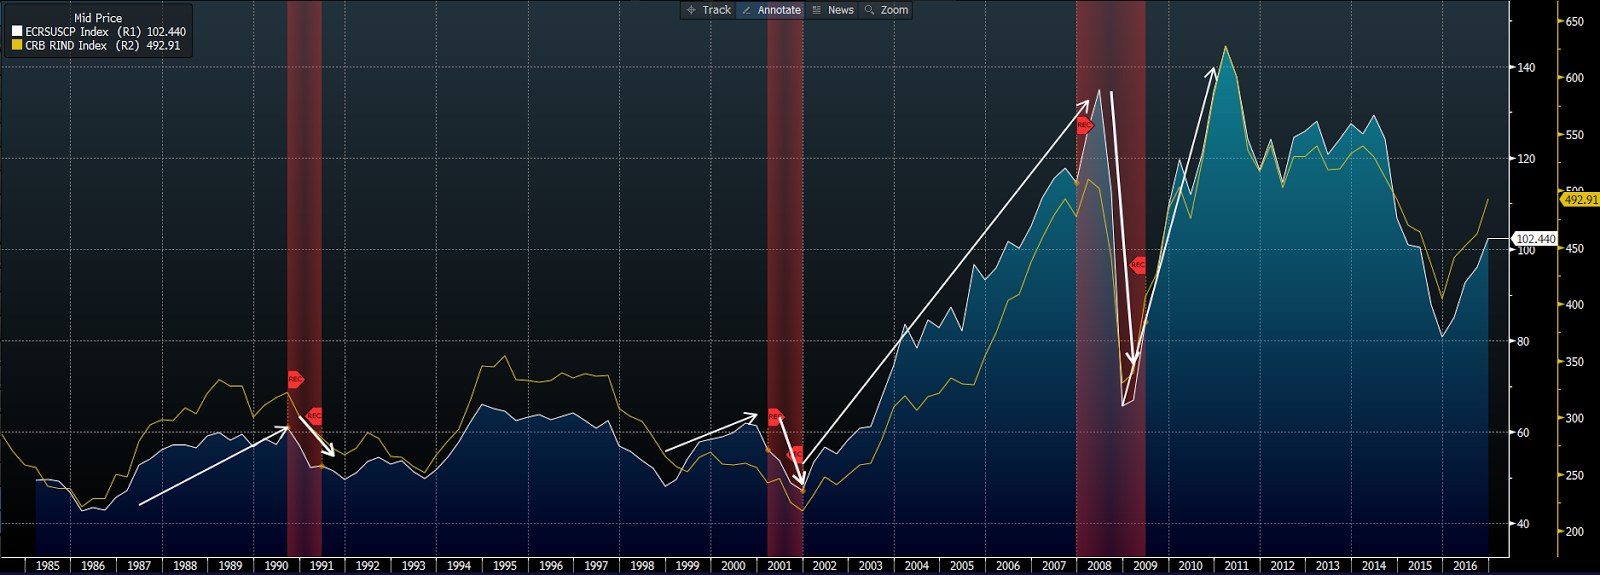
INDUSTRIAL COMMODITIES
INDUSTRIAL
MATERIALS PRICES:
Trends in industrial materials prices can gauge the strength of the global economy. Coming off of a major decline, the present upward trend should be viewed as a positive. However, note that accelerating prices tend to preceded recessions. While many pundits deemed the recent commodity bear market to be a harbinger of terrible economic developments to come, I maintained that outside of recession, lower commodity prices could only, on balance, help the global economy. I see today’s trend as confirmation that the global economy, in the aggregate, is strengthening.
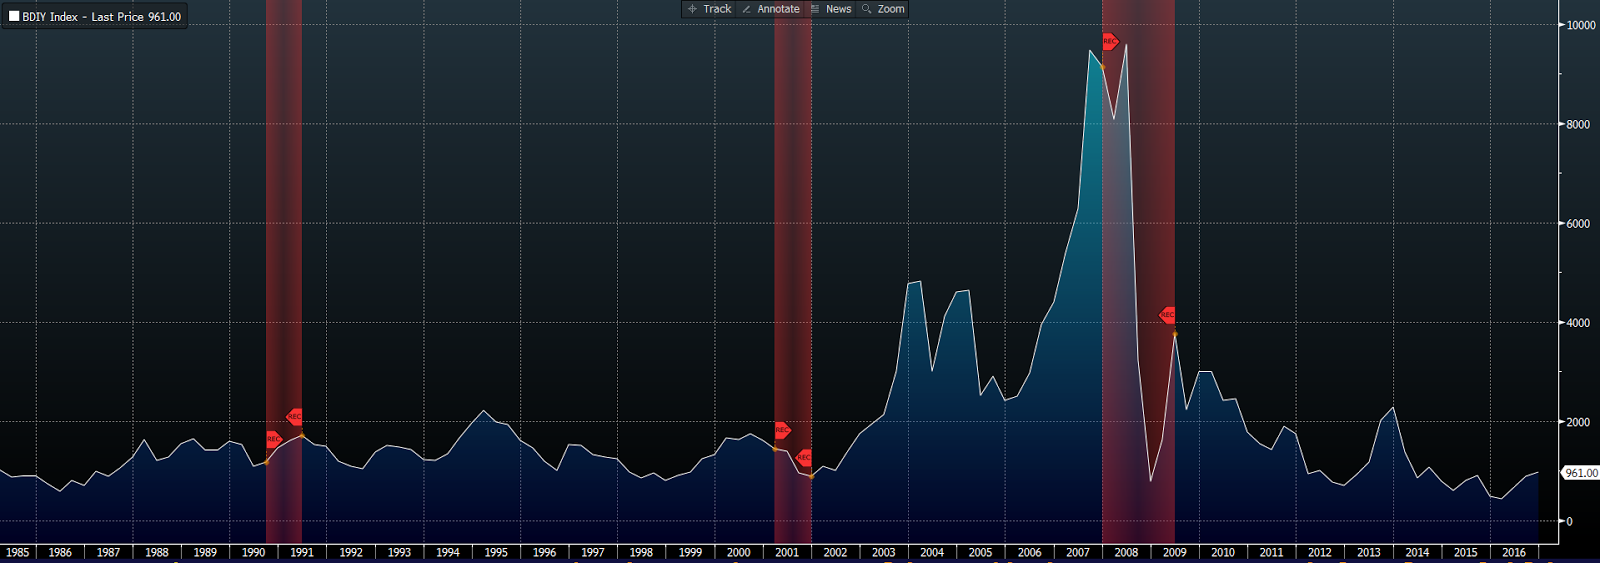
THE
BALTIC DRY INDEX
The BDI tracks the cost of shipping major raw materials across the world’s seas. A rising value denotes increased global demand for raw materials and therefore signals growth in the global economy. That said, a description of the BDI as an indicator, in my view, needs context: For starters, roughly half of cargoes are energy-related. Plus, during the huge China-fueled bull market in commodities the maritime industry ramped up the production of ships. Consequently a glut of capacity was created which no doubt impacts the price of shipping going forward. I.e., more ships relative to shipping demand suppresses what might otherwise be a sharply rising trend in shipping costs.
SUMMARY:
In viewing the above chart patterns relative to prior recessions, it’s easy to feel good about the U.S. economy’s, and, by virtual default, the U.S. stock market’s prospects going forward. Although I must reiterate the point I made in my introductory paragraph: history is replete with examples of down markets during economic expansions and vice versa (we’ll assess the present financial markets’ setup in detail in Part 3).
I must also add that my view of the economy’s prospects is merely based on all information I have at my disposal at this particular moment. Meaning, trends come and go and we have to forever be on the lookout for signs that they are reversing. Our aim is to maintain sector allocations that, at the margin, reflect the most likely macro scenario going forward — while maintaining proper balance and diversification at all times.