

Year-end letters can really be long, so, like last year, we’ll break this year’s into parts.
Part 1:
Today’s Friday 12/23/2016, so the following can’t be full-year stats, but I suspect they’ll be close:
2016 New York Stk Exch Composite Index: +9.57%
2016 Dow Jones Industrial Average: +14.31%
2016 S&P 500: +10.62%
2016 S&P Global 1200: +6.58%
2016 MSCI Europe, Australia, Far East: -3.09%
2016 MSCI Emerging Markets: +7.54%
Here’s a visual of how the year unfolded: click charts to enlarge…
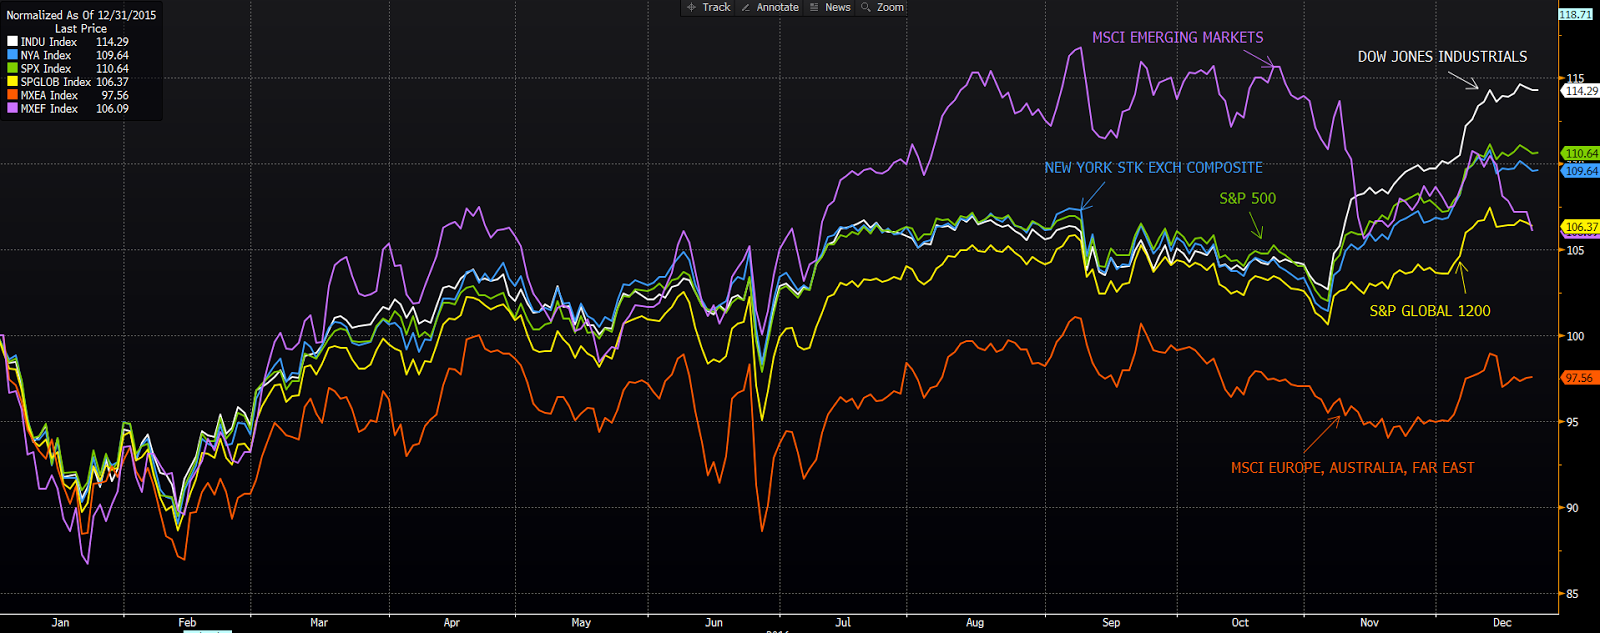
Note how strong emerging market stocks were trending until later in the year. Then note the divergence between them and the Dow. Was it politics? I’d say partly. And let’s hope not “mostly”. For if the strength in the Dow at all reflects stimulative fiscal measures to come, and the pain in non-US reflects protectionism (tariffs and the like) to come, make no mistake, we can’t have it both ways. If the administration commits to restricting the U.S. consumers’ affordable access to global goods (and, thus, sparks trade wars [which such measures absolutely would]), the negative repercussions felt within the financial markets and, ultimately, throughout our economy will, well, let’s just say that we’ll be having a different conversation about market conditions going forward.
Too much certainty coming from someone who preaches that you can’t know the market’s future, and who forever suggests that the market condition heading into events/developments ultimately dictates the price action? Okay, let’s just say that forcing up the cost of goods on U.S. consumers and inciting trade disputes will put what looks to be a very good setup for the stock market to the test.
Speaking of market conditions, take a look at the price to earnings ratios (valuations) of the above referenced indexes:
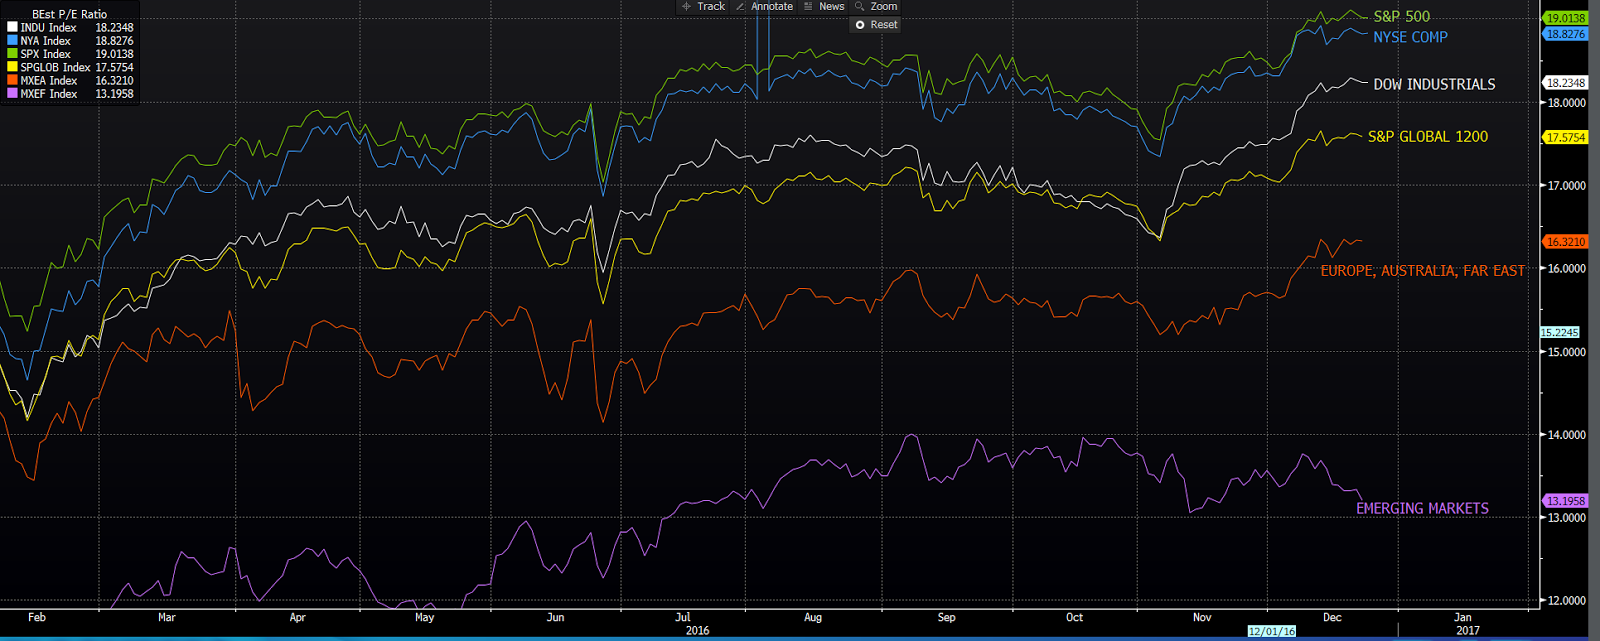
So, if owning securities that reflect attractive relative value is a key ingredient to long-term success, we’ll (for that and other reasons) want to maintain, if not increase, our non-US exposure.
Prior to the election we were signaling herein that the setup for industrials, materials and financials was improving notably. Therefore, we tweaked our target allocations to reflect those positive conditions. Here’s a look at the U.S. market this year by sector (note the late-year [early November on] surge in the cyclical sectors):

Just for fun, let’s look back at 2015:
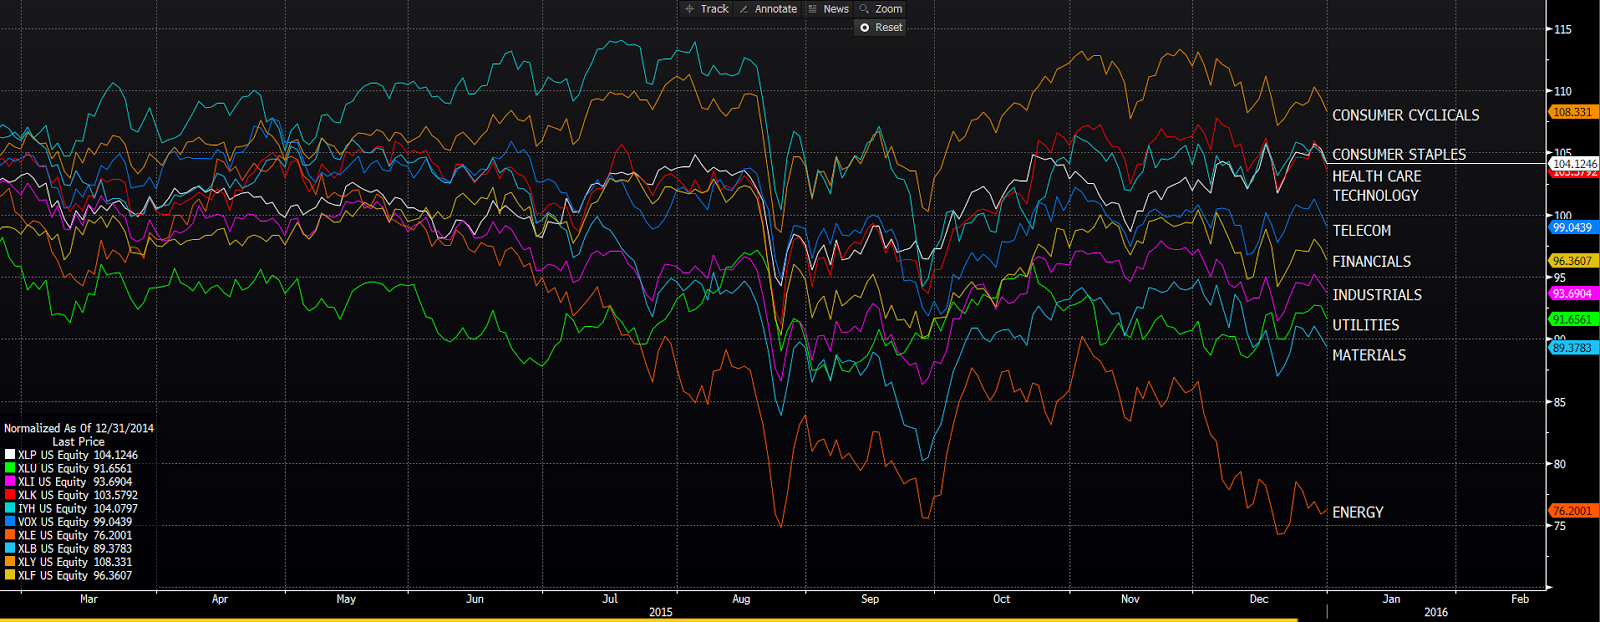
Interesting! Energy was dead last in 2015 and top of heap this year. Consumer Cyclicals was the winner in 2015 and third from the bottom today. Consumer Staples came in second in 2015 and now they sit second to last. Healthcare fell from 3rd place to last place. Financials went from 6th to 2nd.
So do we now cut our exposure to this year’s winners and take up the losers, in anticipation of what we just experienced in relation to 2015? Stay tuned…
Speaking of exposure and relative valuation, here’s a look at the major sectors, their price to earnings ratios based on estimated ’16 and ’17 earnings, our present target allocation (the center of the range we’re after) to each and year-to-date results:
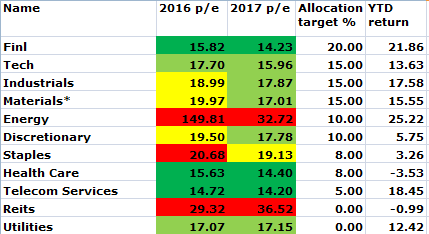
While valuation is absolutely a consideration when determining our sector mix, there’s much more to it. Cyclicality, for example, is a major factor. Take energy: Avoiding oil and gas producers solely based on what appeared to be sky-high valuations would’ve been a major mistake in 2016. Of course energy is a special case; the plunge in oil from $100+/barrel to below $30 literally wiped out the earnings (but not the companies themselves) of even the blue-chippiest of producers. OPEC’s goal of eliminating the shale competition succeeded in one aspect, it eliminated the marginal, heavily leveraged outfits (but not the blue-chippiest). Leaving the more efficient producers to ramp up production as the price rebounded. In fact, at $40+/barrel we’ve been seeing North American rigs coming back on line in a big way. Here’s a one-year chart of the Baker Hughes North American Rig Count:
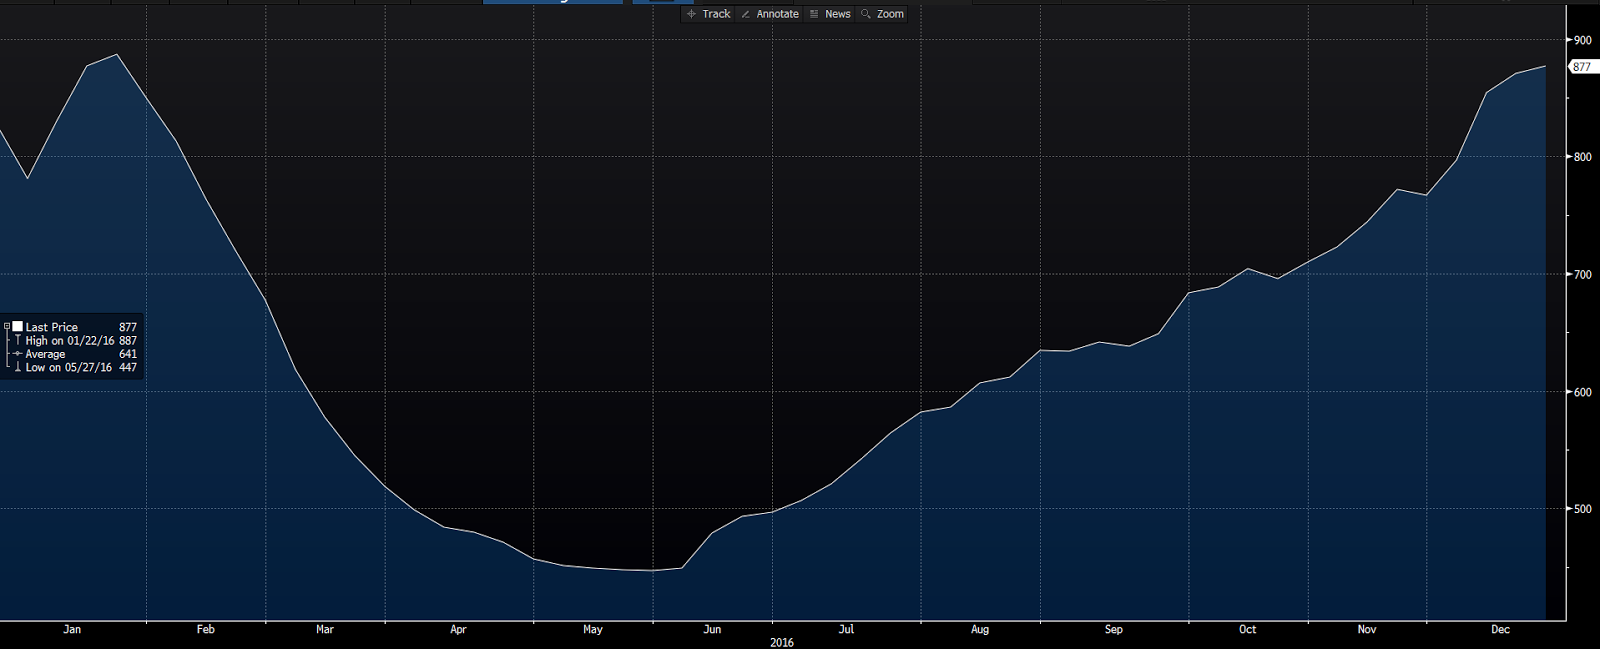
Clearly, the remaining producers can make money at these levels. That’ll improve the valuation picture as earnings reemerge in the coming quarters.
Lastly, what about bonds?
Aside from perhaps a position here and there that a client transferred into his/her portfolio that we’re maintaining for tax planning purposes (or a lower-rated or variable rate scenario that typically isn’t quite as interest rate sensitive), our clients’ portfolios are void of bonds. That’s been a posture that, until recently, has been tough to stomach. But it’s a posture we’d take again under all the same circumstances.
Here’s a chart and a snippet from two recent posts on bonds (this one and this one) where I explained why we’re not yet going there (please follow those two links if you missed those posts):
The iShares Aggregate Bond ETF (white) and the S&P 500 (green) from June 30 through November 23: click to enlarge…
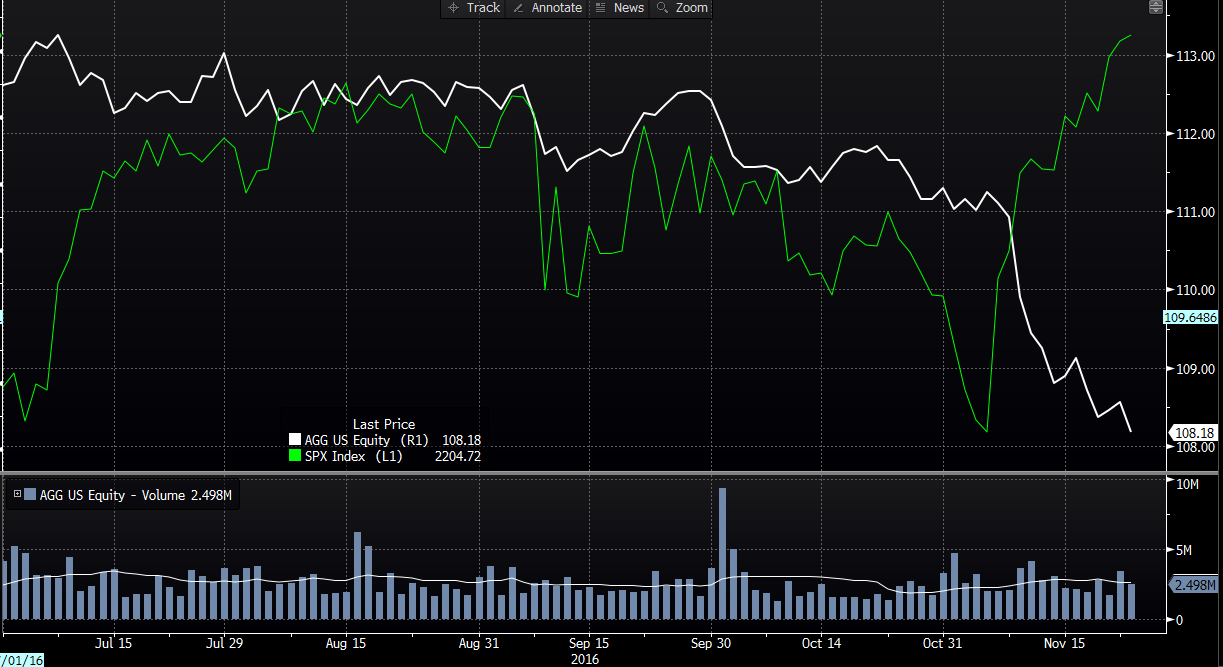
So does this mean that the bond bubble is finally getting pricked? Does it mean that the shocked investors who’ve yet to abandon their bonds stand no chance of getting another chance to bail? Absolutely, unequivocally NO!
Well, of course, it could mean that, I just can’t know for sure. Nor can anyone else, I PROMISE YOU! But we can know the risk. We can know that bonds will always be among the most interest rate sensitive asset classes in existence. We can know that when interest rates are at history-of-mankind lows, that bonds are ultimately (perhaps after central banks run out of ammo) going to be very volatile things to own. And we can, therefore, keep that portion of our portfolios to which we assign stability of principle as the primary objective away from such a potentially volatile scenario.
More to follow…