

Below are some key highlights from our latest messaging herein… Although, before we go there, I thought I’d share some commentary I caught yesterday evening on Bloomberg… This should sound familiar, as it jibes with one of the themes that underlies our structural inflation thesis:
“Think about the inputs that go into traditional energy, starting with oil. Our peak investment in oil was in 2014. Supply has remained tight since then, demand is increasing, and producers are focusing on returning cash to shareholders over pulling more barrels out of the ground. So the bridge from traditional energy to renewable energy is going to be long, we’re still going to need oil, we think prices are going to remain in a higher range than in the past, in the $60 to $80 range, and with upside to $100. That’s inflationary.
And when we take a look at renewable energy, metals go into solar, wind, the grid, into infrastructure, and into hybrid vehicles and batteries. This is cobalt, copper, lithium and nickel. Just taking a look at copper; in the last 25 years US production of copper has dropped by 50%. But we expect demand for copper to double by the year 2035, because of the demand for copper by renewable energy. And from discovery to production of a copper mine, takes 15 years. So inflation in metals and inflation in oil prices should continue to exacerbate the already high inflation problem that we have.”
–Saira Malik, Nuveen
From the blog.
Monday:
EMCI (our Equity Market Conditions Index) declined 17 points in January, denoting net deterioration in equity market conditions; warranting a cautious-leaning portfolio allocation stance with regard to US equities.
Generally hawkish Fed policy, rising interest rates and deteriorating credit market conditions joined valuation, economic conditions and geopolitics in the bearish category. While only the US dollar (technically neutral from bullish [a bullish dollar is bearish for equities right here]) showed month-on-month improvement.
The above said, SP500 technicals and sector leadership remain potentially-consequential near-term supportive setups for stocks.
Last Thursday:
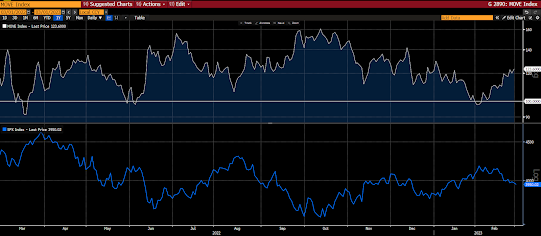
While investors generally associate the VIX Index (tracks SP500 options’ volatility) with stock market volatility, turns out the MOVE Index (tracks treasury options volatility) is every bit (if not more so, these days) as serious a tell on the risk setup for stocks.
When (top panel) it’s lived above 100 (particularly during sustained periods) during this 21st Century, stocks (bottom panel) were living dangerously:
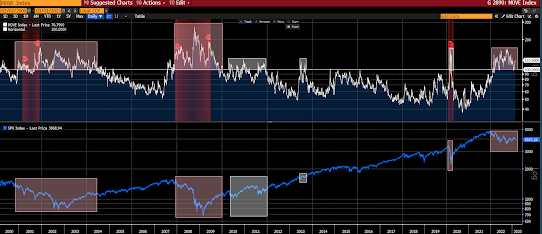
Especially when it’s on the rise (and above 100), like now:
Last Tuesday:
Speaking of inflation, while our own current data-and-history-derived bent — after a potential recession-induced plunge — has it structurally higher than the past several decades, simple base effects over the next few months are a notable headwind… Before, that is, they become a notable tailwind during the second half of the year.
Per Forbes:
“For the first six months of 2022 the monthly increase in the Unadjusted Index was between 1.605 and 4.015 or 0.56% to 1.37% (see table below). This makes for easy compares or the Base Effects helping to lower the inflation rate in the first half of 2023.
After that the compares are much tougher as the month-to-month readings were two slightly negative readings in July and August, a small increase in September, a slightly larger increase in October and a larger drop in November.
The average change in the Index the last five months is a positive 0.43 with November’s decline of (0.301) or a negative 0.1%. Note that the Unadjusted Index is not seasonally adjusted vs. a seasonally adjusted month-to-month increase of 0.1% that is also announced in the CPI press release.
January: 2.346 or 0.84%
February: 2.568 or 0.91%
March: 3.788 or 1.34%
April: 1.605 or 0.56%
May: 3.187 or 1.10%
June: 4.015 or 1.37%
July: (0.035) or (0.01)%
August: (0.015) or (0.04)%
September: 0.637 or 0.22%
October: 1.204 or 0.41%
November: (0.301) or (0.10)%”
Friday 2/17:
So, with inflation about to mount a serious decline over the coming months, stocks should be set to seriously rally, right?
Well, on the news, that wouldn’t surprise me… However, there’s another, bigger, issue within the above scenario!
It’s this one I keep showing you:
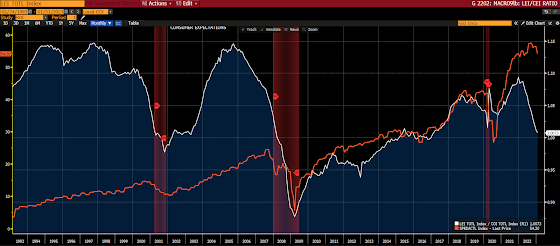
That orange line is S&P 500 earnings… That one has me thinking like (push the play button):
Stay tuned… oh, and stay hedged!
Asian stocks were mostly red overnight, with 11 of the 16 markets we track closing lower.
Same for Europe so far this morning, with 15 of the 19 bourses we follow trading down as I type.
US equity averages are up to start the session: Dow by 189 points (0.55%), SP500 up 0.59%, SP500 Equal Weight up 0.27%, Nasdaq 100 up 0.77%, Nasdaq Comp up 0.57%, Russell 2000 up 0.02%.
The VIX sits at 18.95 down 0.94%.
Oil futures are up 1.53%, gold’s up 0.21%, silver’s up 1.10%, copper futures are up 0.28% and the ag complex (DBA) is up 0.20%.
The 10-year treasury is up (yield down) and the dollar is down 0.36%.
Among our 35 core positions (excluding options hedges, cash and short-term bond ETF), 29 — led by AMD, Amazon, XLE (energy stocks), SLV (silver) and XLK (tech stocks) are in the green so far this morning. The losers are being led lower by XLF (financial stocks), VWO (emerging market equities), JNJ, DBB (base metals futures) and Dutch Bros.
“A man must study general conditions, to seize them, so as to be able to anticipate probabilities.”
–Jesse Livermore
Have a great day!
Marty