In June 2017, after decades of parsing volumes of economic data, constructing our attendant views and applying them, we decided to create our own index and formally track the data we felt were most telling in terms of giving an on-the-ground, real-time assessment of general conditions.
We then ran it back a ways to determine how revealing it would have been over the past couple of cycles.
The white line in the graph below represents the S&P 500 Stock Index, the numbers plotted along the line represent the PWA Index’s score at the time, the red shaded areas represent recessions:
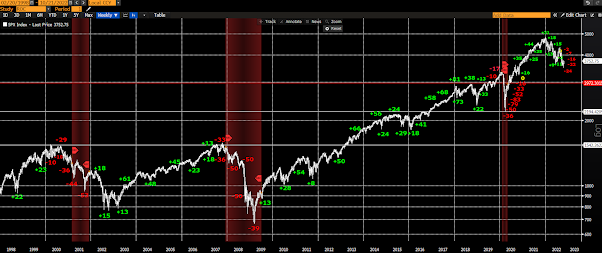
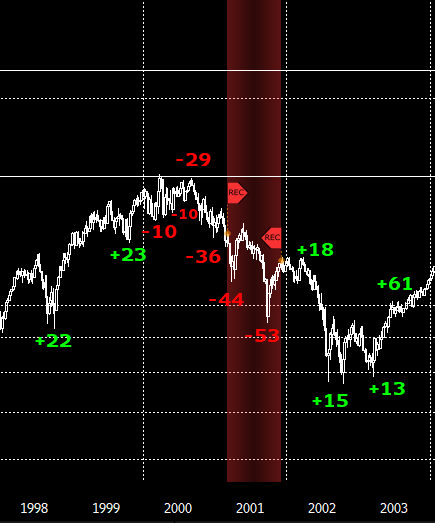
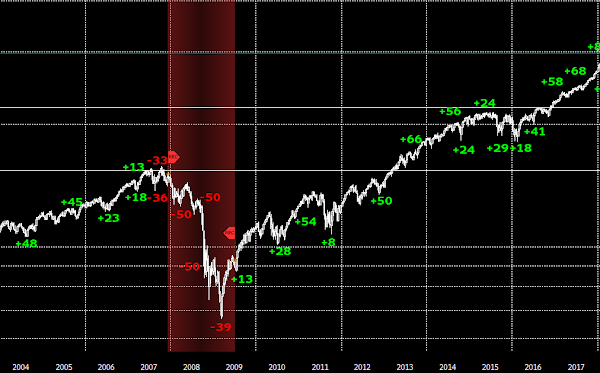
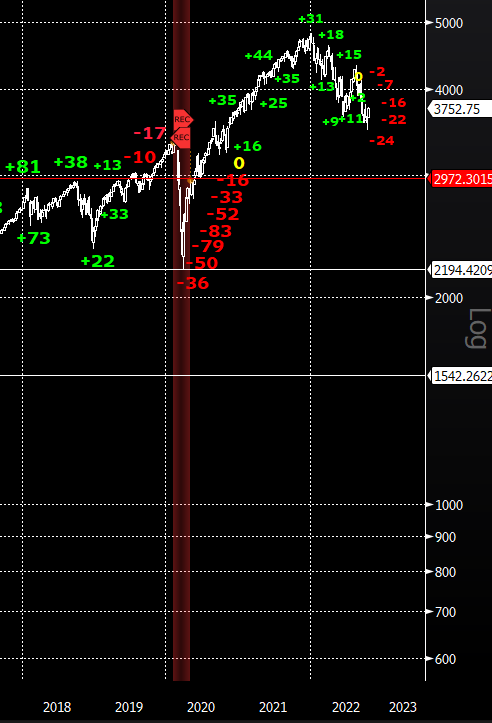
As you can see, our index went into the red ahead of each of the previous 3 recessions and “official” bear markets in stocks (the covid bear market, frankly, as I’ve explained in video commentaries, didn’t satisfy our bear market criteria).
“While our 3,500 S&P 500 downside target continues to make sense to us, suffice to say that global macro conditions are waning to the point that could have us seriously re-thinking that scenario over the coming weeks/months…”
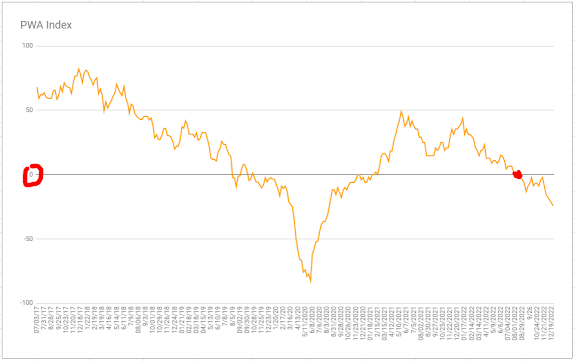
Well, alas, within 2 months, our assessment indeed deteriorated to that point:

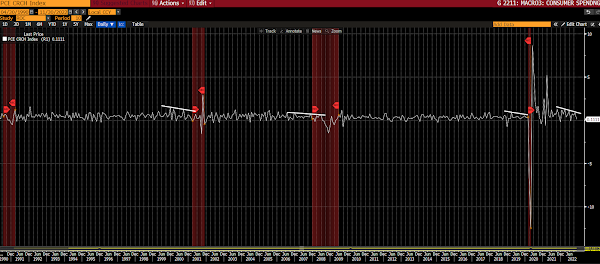
Auto Sales — the higher lows since June are encouraging:

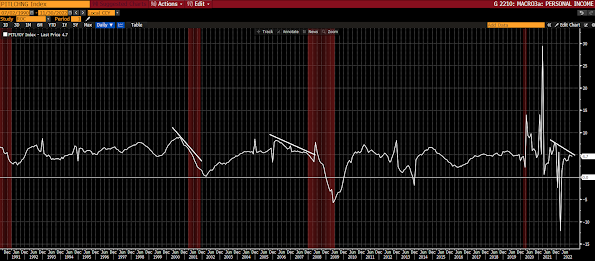
Personal Income:
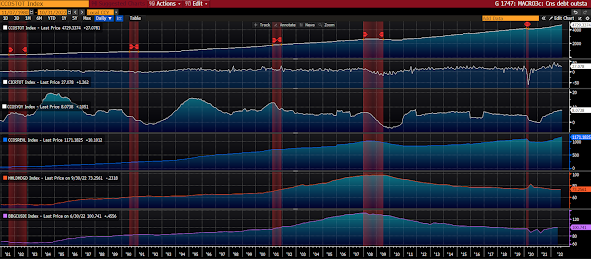
Various Consumer Debt Metrics:
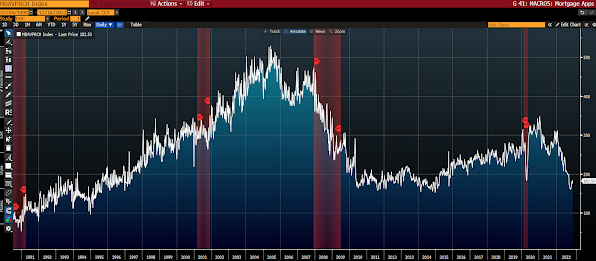
Mortgage Purchase Applications:
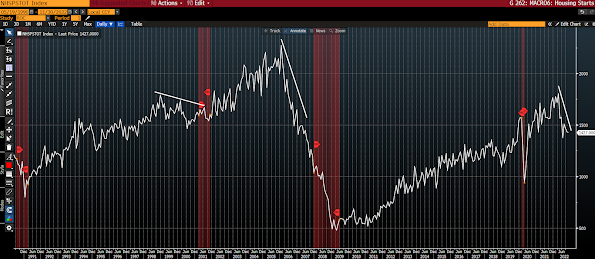
Housing Starts:
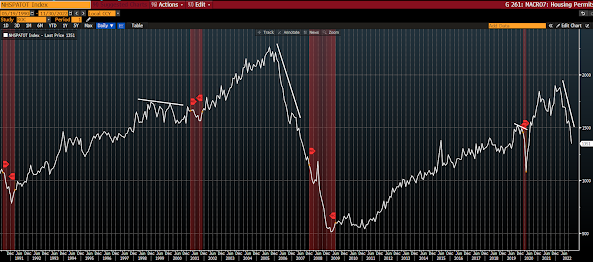
Housing Permits:
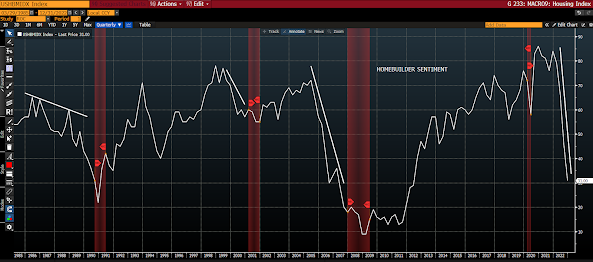
Homebuilder Sentiment:
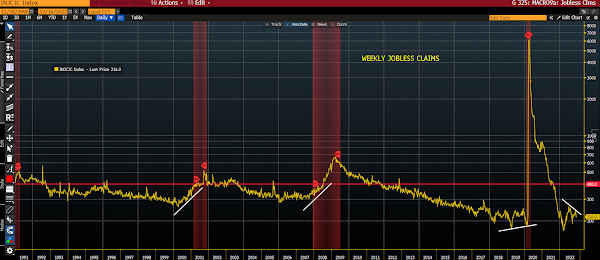
Weekly Unemployment Claims — remain encouraging:
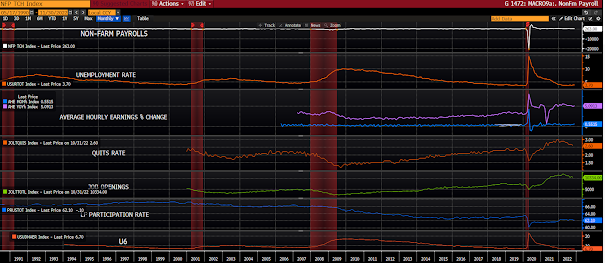
Various Other Employment Metrics — not signaling recession right here:
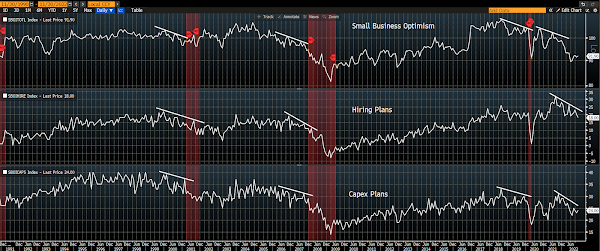
Small Business Sentiment:
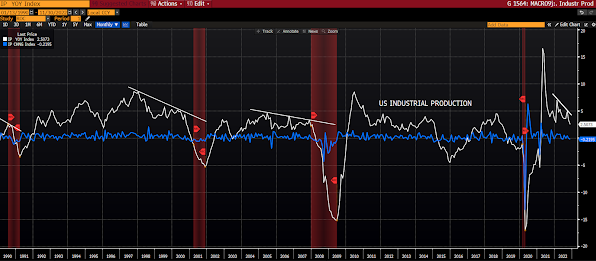
Industrial Production:

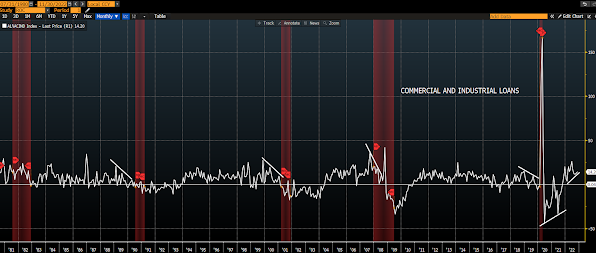
Commercial and Industrial Loans — constructive:
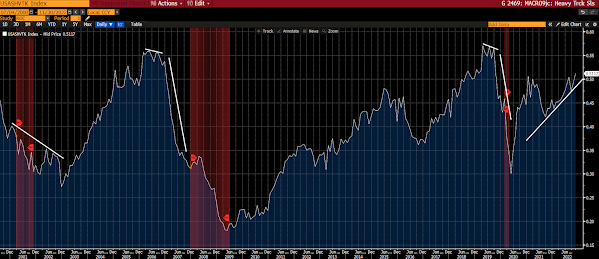
Heavy Truck Sales — not signaling recession:
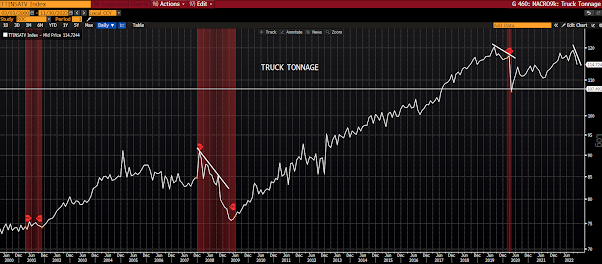
Truck Tonnage:
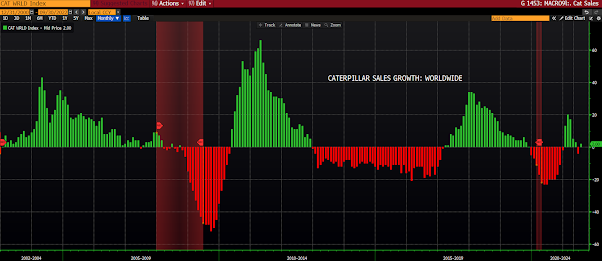
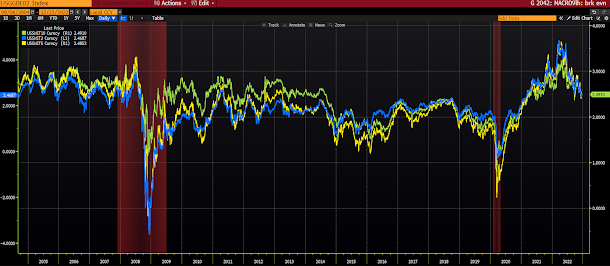
Caterpillar Global Sales — seeing slight growth after declining in Q2:
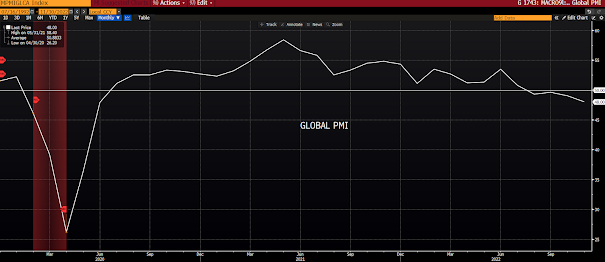
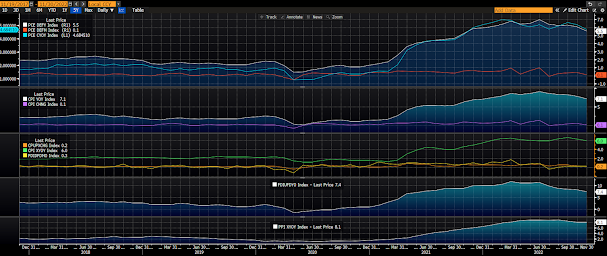
Global Purchasing Managers Index:
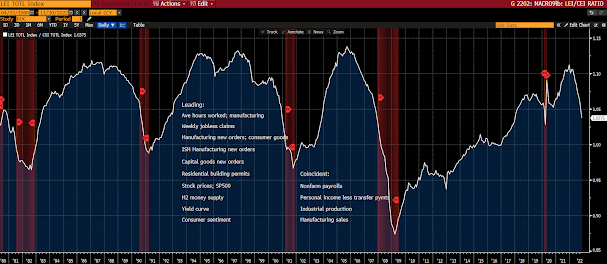
Leading Economic Indicator/Coincident Economic Indicator Ratio:
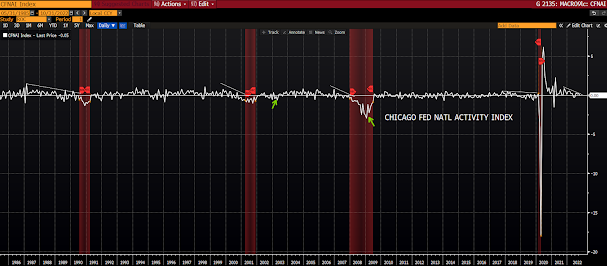
Chicago Fed National Activity Index:
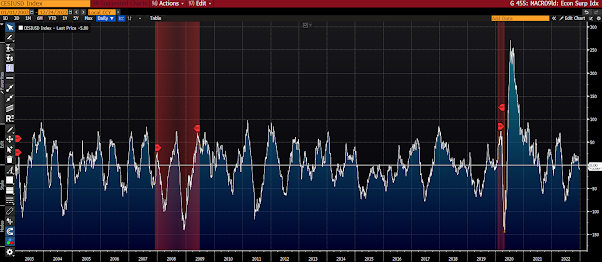
Citigroup US Economic Surprise Index:
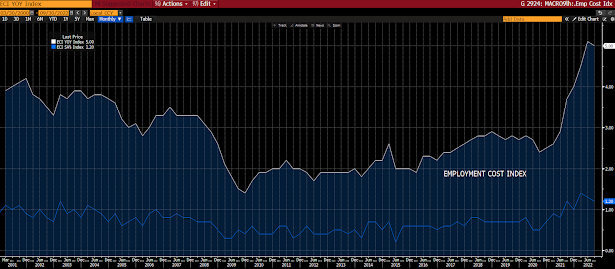
Various Inflation Metrics:
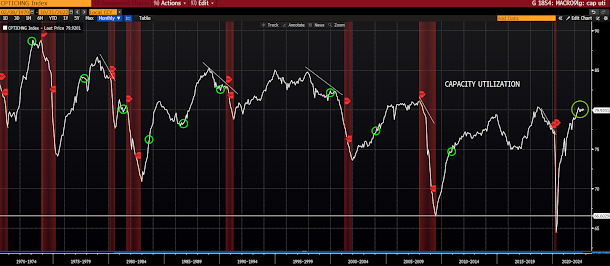
Capacity Utilization — constructive:
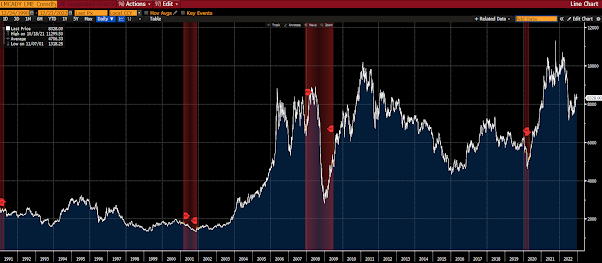
Copper Price — constructive, of late:
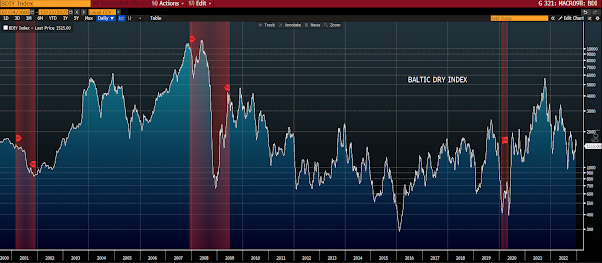
Baltic Dry Index:
1-Month Sector/SP500 Ratios.
Tech:

Financials:

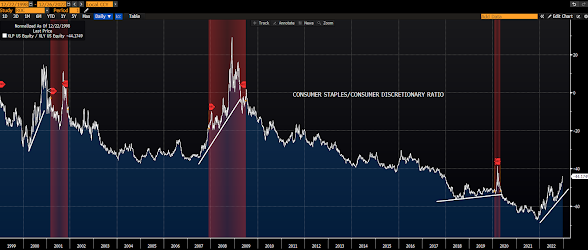
Consumer Discretionary:

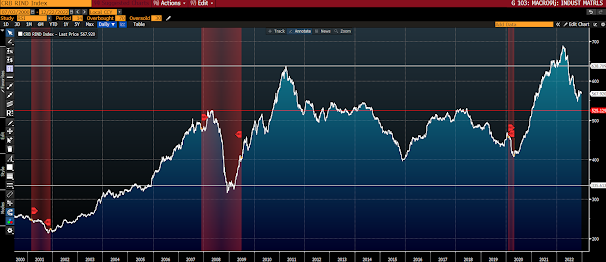
Materials — constructive:

Energy — constructive:

Industrials — constructive:

Consumer Staples (economically-defensive sector):

Utilities (economically-defensive sector):

Healthcare (economically-defensive sector):