In yesterday’s note I mentioned that “our modeling” favored the notion that the recent weakness in the tech sector is more about a change in leadership versus the harbinger of something more pernicious.
Here are a number of the key indicators that instruct our theses around equity markets and have us, per yesterday’s note, relatively sanguine — yet nevertheless cautious (the +1s, -1s and 0s denote positive, negative and neutral signals):
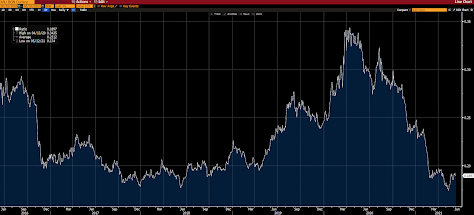
Established downtrend from March 2000 peak.
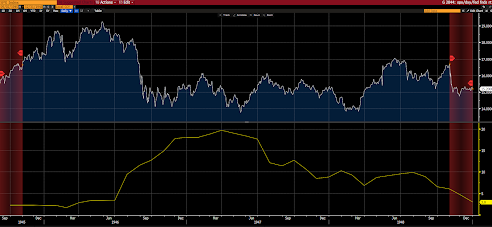
INTEREST RATES: +1
Fed funds at zero lower bound, 10-year treasury yield remains in long-term downtrend. Inflation pressures on the other hand are high. However, given the present state of debt markets and the huge risk that a higher dollar, and interest rates, pose to asset bubbles, the Fed will resort to YCC if necessary. Therefore, rather than scoring a bearish -1, as we’d expect given that there’s no way to go but up from here, the bottom line is simply that there’s nowhere for interest rates to go, whatsoever.
FED POLICY: +1
Resoundingly easy.
FISCAL POLICY: +1
Huge spending impulse enough (presently) to counter threat of higher taxes/regs.
VALUATION: -1
Historically overvalued.
P/E: 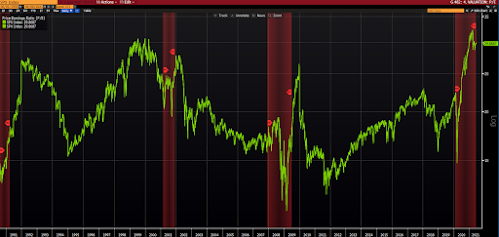
CAPE: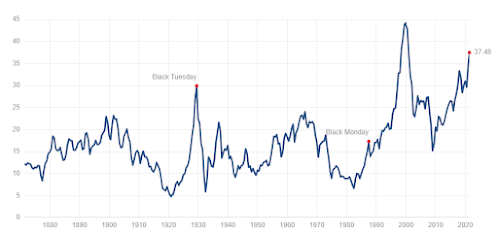
P/S: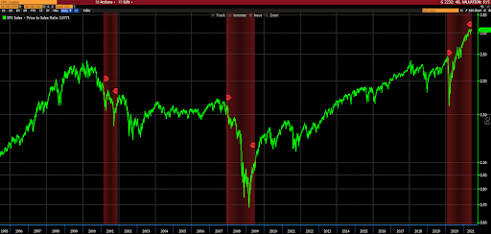
P/B: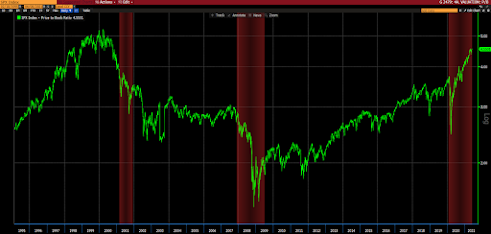
MC/GDP: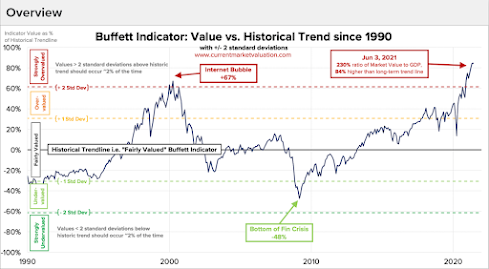
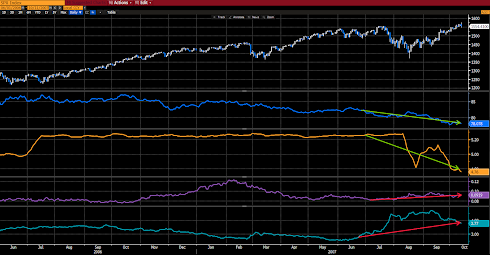
SECTOR LEADERSHIP: 0
Tech is showing a toppy pattern… denoting either rotation, or classic leadership rollover that precedes bear markets: -1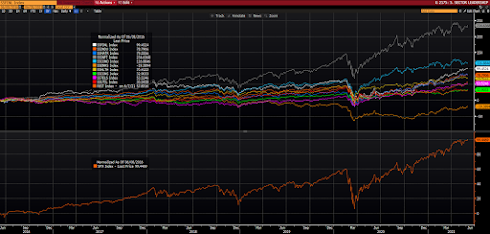
However, save for Consumer Discretionary, the other cyclical sectors have outperformed SPX over the past 6 months, while the defensive sectors have underperformed: +1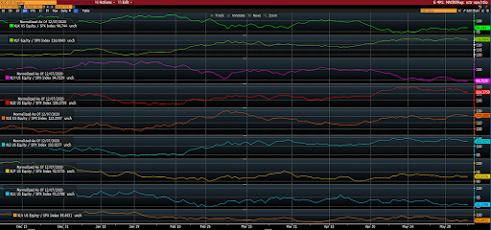
MACRO CONDITIONS: +1
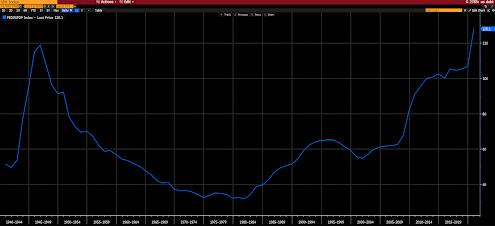
GEOPOLITICS: -1
China losing its luster, notably (growing belligerence). U.S. and traditional allies’ relations improved of late. U.S., nevertheless, disconnecting militarily throughout the globe. U.S. no longer the protector of the world. Greatest potential for trade flow disruptions in decades.
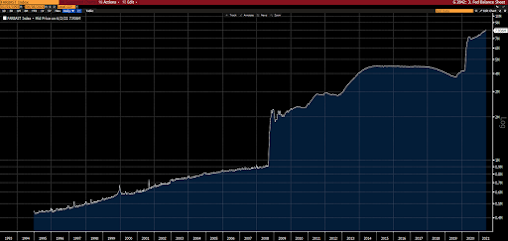
GLOBAL ECONOMIC POLICY UNCERTAINTY INDEX: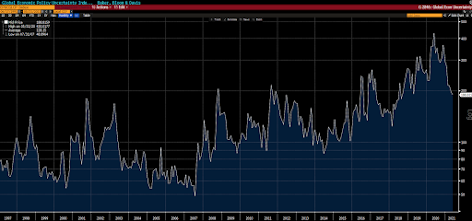
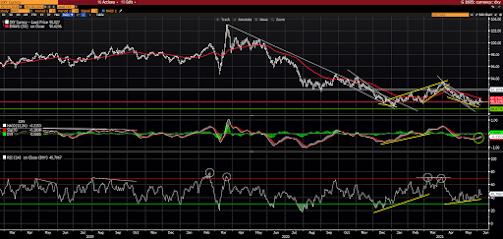
TECHNICALS: 0
DAILY: 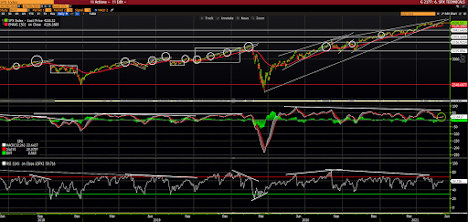
WEEKLY: 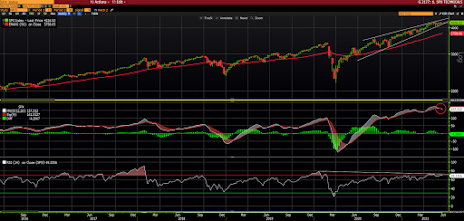
MONTHLY: 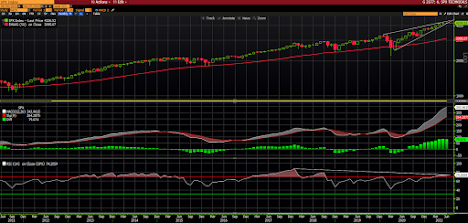
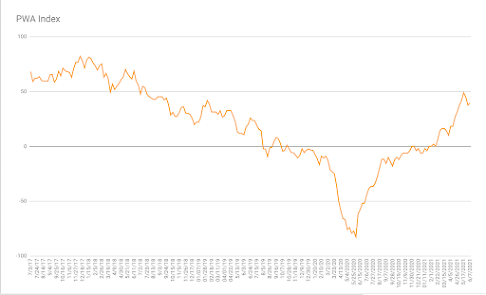
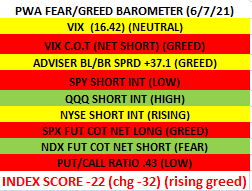
SENTIMENT: -1
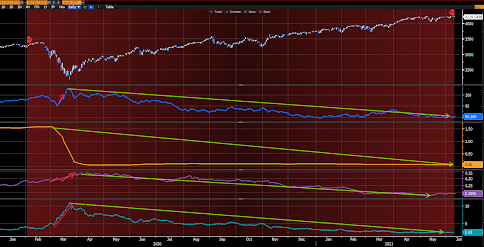
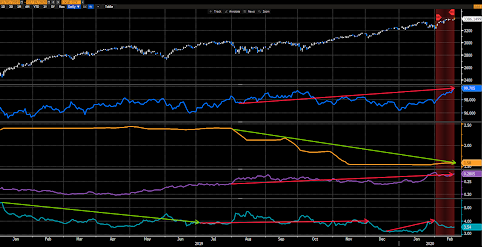
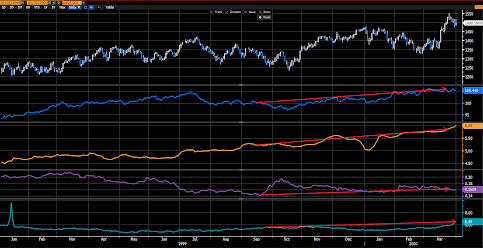
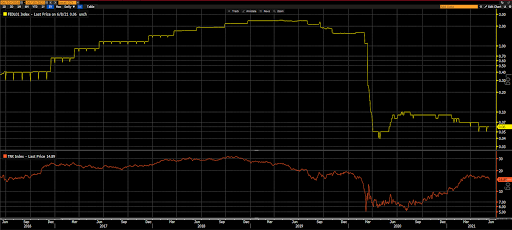
FINANCIAL STRESS: +1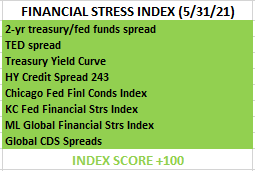
GOLD/COPPER RATIO: +1