As I sit here staring at a blank screen, thinking that I’ve sufficiently (and some!) expressed our primary theme/thesis herein of late, I glance over at an adjacent screen featuring our core positions and notice today’s top 10 performers, in the following order:
MP (rare earth miner), DBA (ag futures), URNM (uranium miners), XME (base metals miners), KRBN (carbon credits), SLV (silver), VIAC/CBS, XLE (energy stocks), GDX (gold miners) and XLP (US consumer staples stocks).
Save perhaps for XLP, the above captures much of the gist of our view on probabilities over the years to come, with the exception of what we see as attractive relative value in non-US equities these days (those positions, ironically, are prominent among today’s bottom 10 performers).
As for today’s top 10, all in they presently occupy 19.84% of our total core portfolio. The bottom 10 on the day — TAN (solar stocks), FAN (wind stocks), FEZ (Eurozone equities), ILF (Latin American equities), VPL (Asia-Pac equities), VWO (emerging market equities), EWW (Mexican equities), INDA (Indian equities), XLU (US utilities stocks) and XLK (US tech stocks) — occupy 33.97% of our overall mix.
The middle (the remaining 46%) consists of, among other things, US healthcare, materials and financials stocks, gold, cash, short-term bonds, etc.
Today’s top performing position, MP, rose 3.45% on the session, the bottom, TAN, fell 2.67%. Overall, our portfolio rose 0.24%. The S&P 500, by the way (not that it matters), rose 0.13%.
Now, I referenced the S&P 500, not because given our macro view/approach it’s the thing to do, but because that’s what “the industry” tends to reference. Why “the industry” doesn’t benchmark itself against, say, inflation (now that matters!)… well… that’s not the least bit sexy. And, yes, and alas, “the industry” has tethered itself (and its investor clients) to the stock market.
And, truth be told, I simply needed a clean segue into the meat of this week’s message…
My intent herein today is not to bash the industry, so I’ll cease it here — after, that is, stating that, as we sit here today, the average American household holds the highest percentage of its net worth ever in the U.S. stock market, while U.S. equity valuations, by several key metrics, rest at their loftiest points ever. And, not to mention, government and corporate debt sit at all time extremes (highs) while interest rates remain at or near all time lows…
What on Earth could possibly go wrong?!?
Well, speaking of lofty valuations, we monitor 5 separate metrics within the valuation component of our own equity market conditions index. And, per the above (and below), yes, that particular component drags on our overall score. However, factoring in the other 10 components, equity market conditions remain, on balance, and albeit moderately, bullish — with a score of +27 (range -100 to +100), as of this morning.
Before I highlight what we view as key tells with regard to the current state of the stock market, allow me to emphasize that at no other time during my 37-year career has critical, out of the box thinking on all things market, economic and public policy, been so, well, critical for the serious macro-driven investor.
The term “it’s different this time” has been popularly dubbed the four most dangerous words in investing. And, yes, I sympathize. I.e., just when the investor crowd comes to believe that valuations don’t matter, that debt doesn’t matter, that trees grow to the sky, that what goes up mustn’t necessarily come down.. well, you know…
Now, that said, in some respects it is indeed different this time (the Federal Reserve, for example, can do things [purchase non-govt-backed securities] that pre-COVID were illegal) –– if, that is, we’re talking the past half-century or so.
Venture a bit further back, however, and as we’ve explored some stark similarities — particularly with regard to debt, interest rates, fiscal and monetary policy — to other periods in history emerge. And the playbook for such setups is notably different than the one we followed right up to late-2019 — the one Wall Street and, sadly (ultimately) I’m afraid, individual investors en masse continue to follow today.
Hence, per my disclosure above, while we continue to own the basics — tech, healthcare, staples, industrials, cash, high quality ultra short-term bonds and so on — we’ve taken on positions that are uniquely suited to massive government spending, complicit monetary policy, green energy initiatives in a world of underwhelming capacity to produce the metals and minerals they demand, and a notable departure from many of the global dynamics that kept inflation at bay these past many decades… While selectively hedging (with options) to mitigate the effects of potential major market meltdowns…
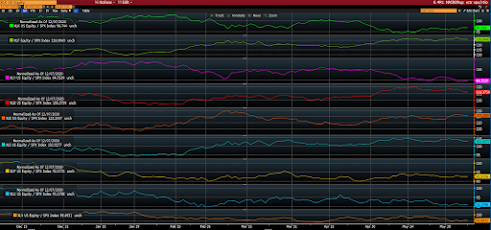
Here, in closing, is a snapshot of the components in our equity market conditions index:
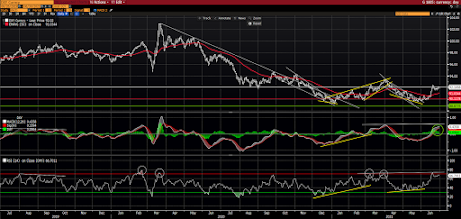
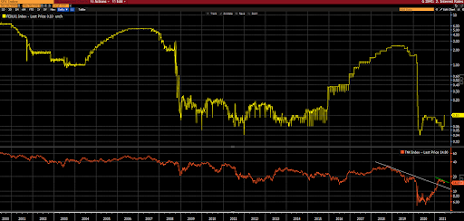
US DOLLAR: 0
Testing recent resistance, 50-dma turning up, minor bullish RSI divergence.
INTEREST RATES: +1
Fed funds at zero lower bound, 10-year treasury yield rolling back over.
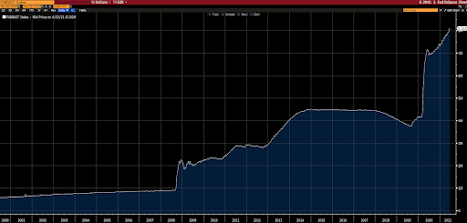
FED POLICY: +1
Notwithstanding the potential for tapering mortgage purchases by year-end, policy remains resoundingly easy.
Fed Balance Sheet $8.1 trillion:
FISCAL POLICY: +1
Huge spending impulse enough (presently) to counter threat of higher taxes/regs.
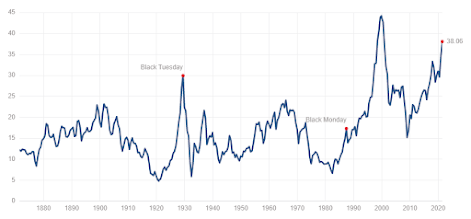
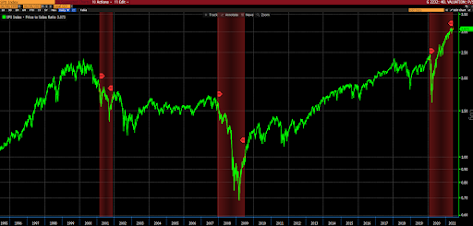
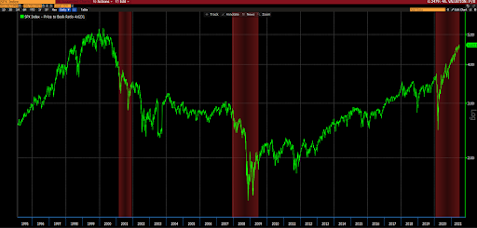
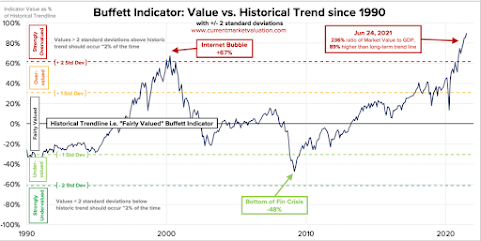
VALUATION: -1
Historically overvalued.
P/E 30.34:
CAPE 38.06:
P/S 3.07:
P/B 4.62:
MC/GDP 236%:
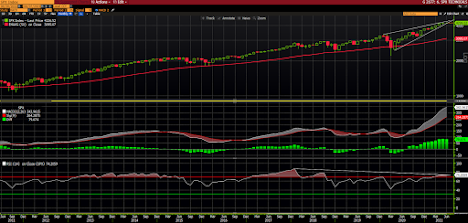
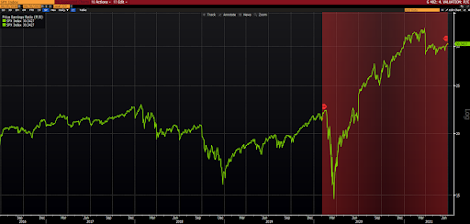
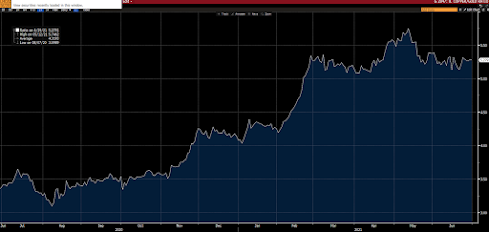
Tech breaking out to new highs: (+1)
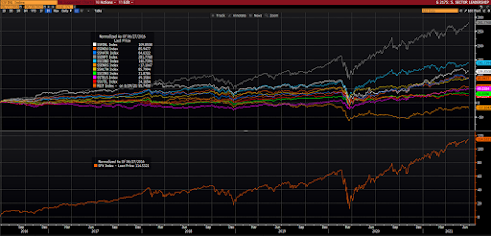
Tech and XLY outperforming SPX past month. Materials, energy industrials, financials, notably underperforming. Healthcare outperforming: (-1)
MACRO CONDITIONS: +1
PWA MACRO INDEX +41.67 (+1)
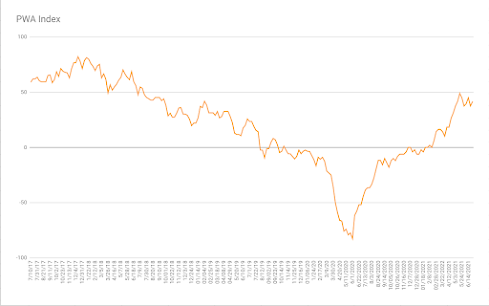
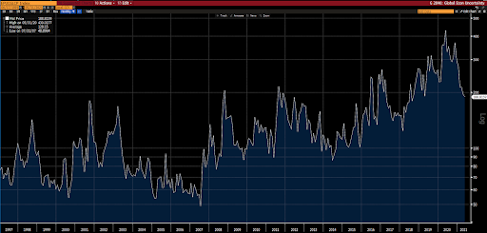
GEOPOLITICS: -1
China losing its luster, notably (growing belligerence). U.S. and traditional allies’ relations improved of late. U.S., nevertheless, disconnecting militarily throughout the globe. U.S. no longer the protector of the world. Greatest potential for trade flow disruptions in decades.
GLOBAL ECONOMIC POLICY UNCERTAINTY INDEX:
TECHNICALS: 0
DAILY: 0
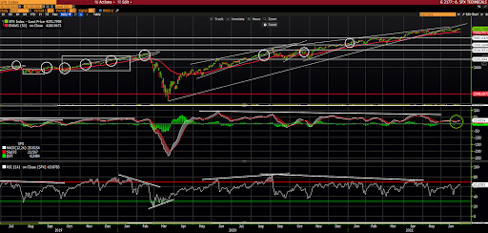
WEEKLY: -1
MONTHLY: +1