

Typically, whenever someone says to me how crazy, volatile, unpredictable, etc., the market is, I’ll tell them that on a day-to-day basis it’s pretty much always been that way.
Well, the operative word above would be “typically”; which doesn’t nearly capture the character of the conditions we presently face. Thus, I must confess, I’m feeling less certain about immediate prospects than I can ever remember — and, trust me, I’ve been intimately attuned to plenty over my 35-year relationship with the market.
As I read the short-term tried and often true technical tea leaves — as I did for you on the S&P 500 hourly chart in Friday’s video — I absolutely know that a tweet can instantly blow one’s trading edge to smithereens.
“Is the market going to go up or down? What about the economy? What’s the Fed going to do in September? Will Trump tone down the rhetoric against China or ramp things up? We’ll be the first to admit that there’s ALWAYS uncertainty when it comes to the market or economy, but it’s hard to remember a time when uncertainty levels were this high and so much of the potential outcome was this binary in nature while the power to control it was as concentrated in one person as it is now.”
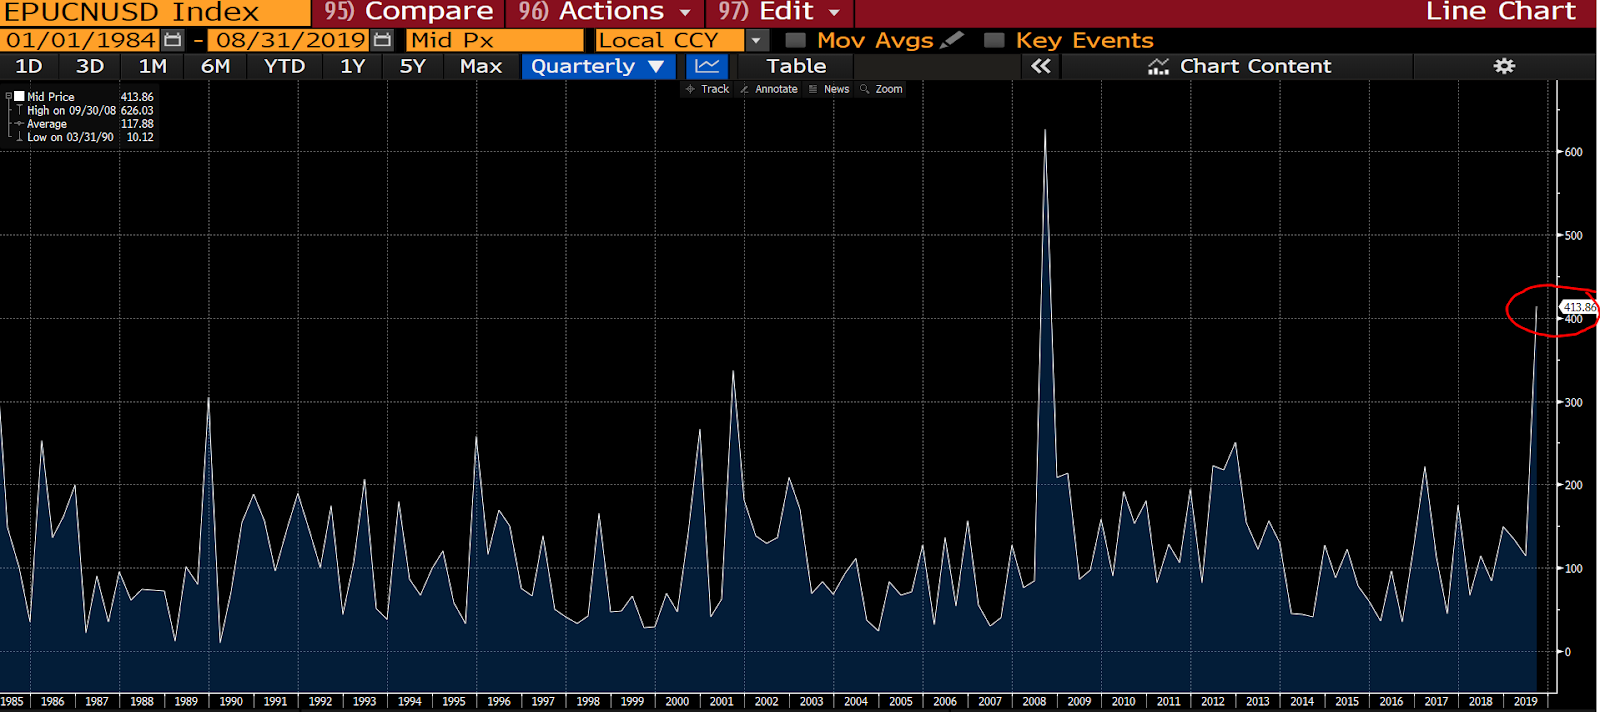
Seems like you can find an index to track just about anything. Yep, there’s even one that tracks economic policy uncertainty in the U.S..
Established on January 1, 1985, The Baker, Bloom and Davis U.S. Economic Policy Uncertainty Index is based on the archives of thousands of news sources from across the globe. As you might imagine, the latest reading is topped only by the one registered in Q3, 2018, during the depths of the Great Recession:
So what’s one to do? Well, if one is attempting to “trade” this market, I wish him/her luck, for the most skillful trader, I’m quite certain, is having one devil of a go of it these days.
So what are we here at PWA to do? Well, we maintain our intense focus on the data that matter, while tracking market trends, intermarket relationships, and the ever-developing patterns in price, volume, breadth, valuation, etc., as we assess general conditions and the risk/reward setups that dictate our actions within client portfolios.
As we’ve been discussing and illustrating herein, we see real under-the-surface cracks forming in the macro economic setup. All the while there’s this popular (in some circles) narrative that those of us expressing such concerns run the risk of talking the economy into recession. Hmm… well, sure, sentiment is huge when it comes to the economy, but I can think nothing more dangerous/irresponsible for an investor or money manager to do than to pretend everything’s perfectly okay, when clearly it isn’t. We must see things as they are, and act accordingly.
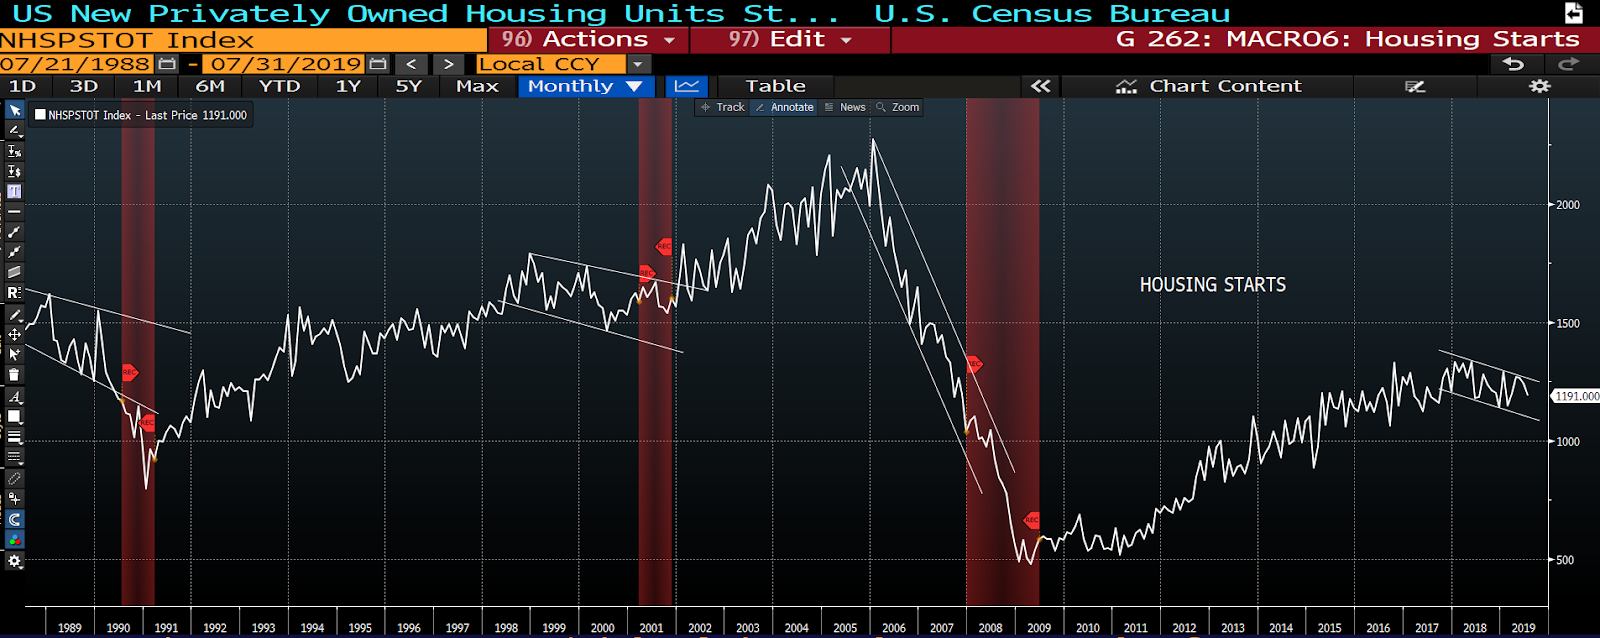
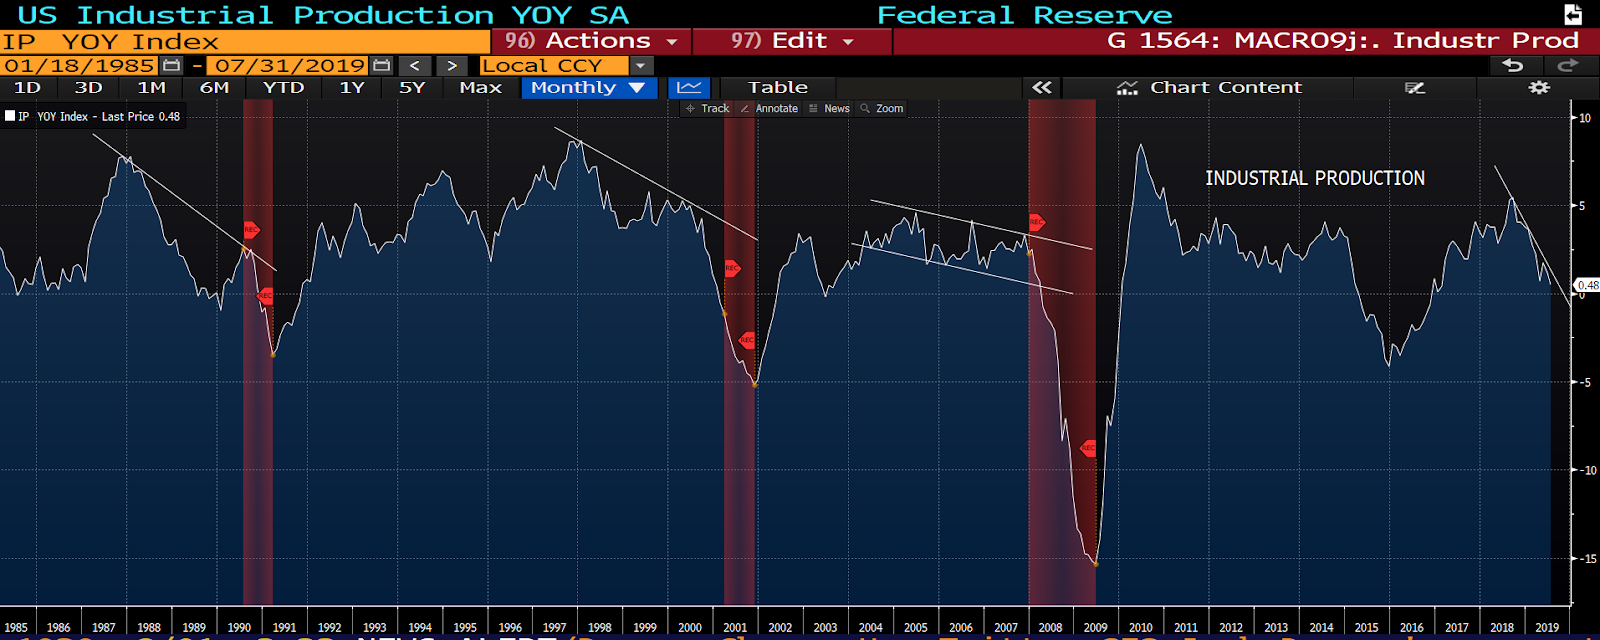
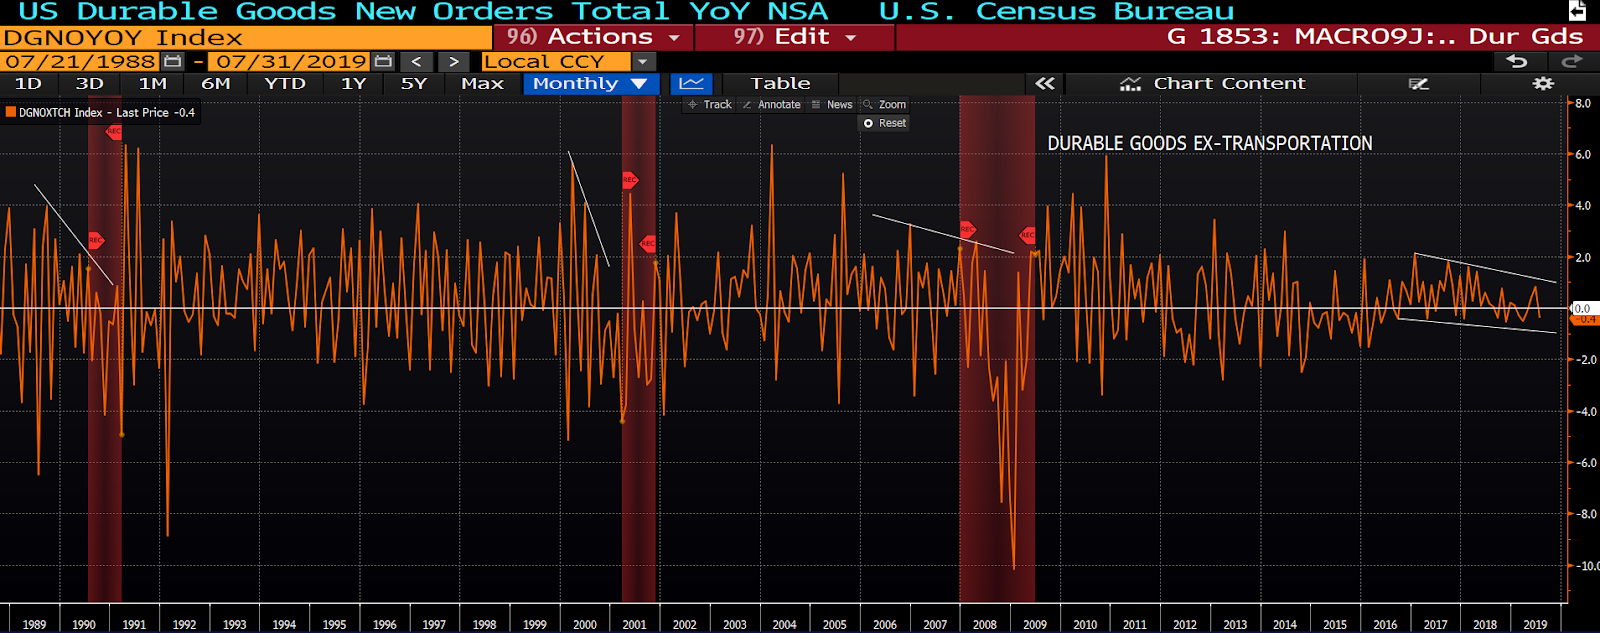
Speaking of “seeing things as they are”, here’s our charting of some of the data points that currently weigh on the Economic and Financial Stress subindexes within our proprietary macro index — which just came in below zero (heightened recession risk) for the 5th consecutive week:
Past recessions highlighted red… click any insert to enlarge…
Housing Starts
Industrial Production
Durable Goods Ex-Transportation
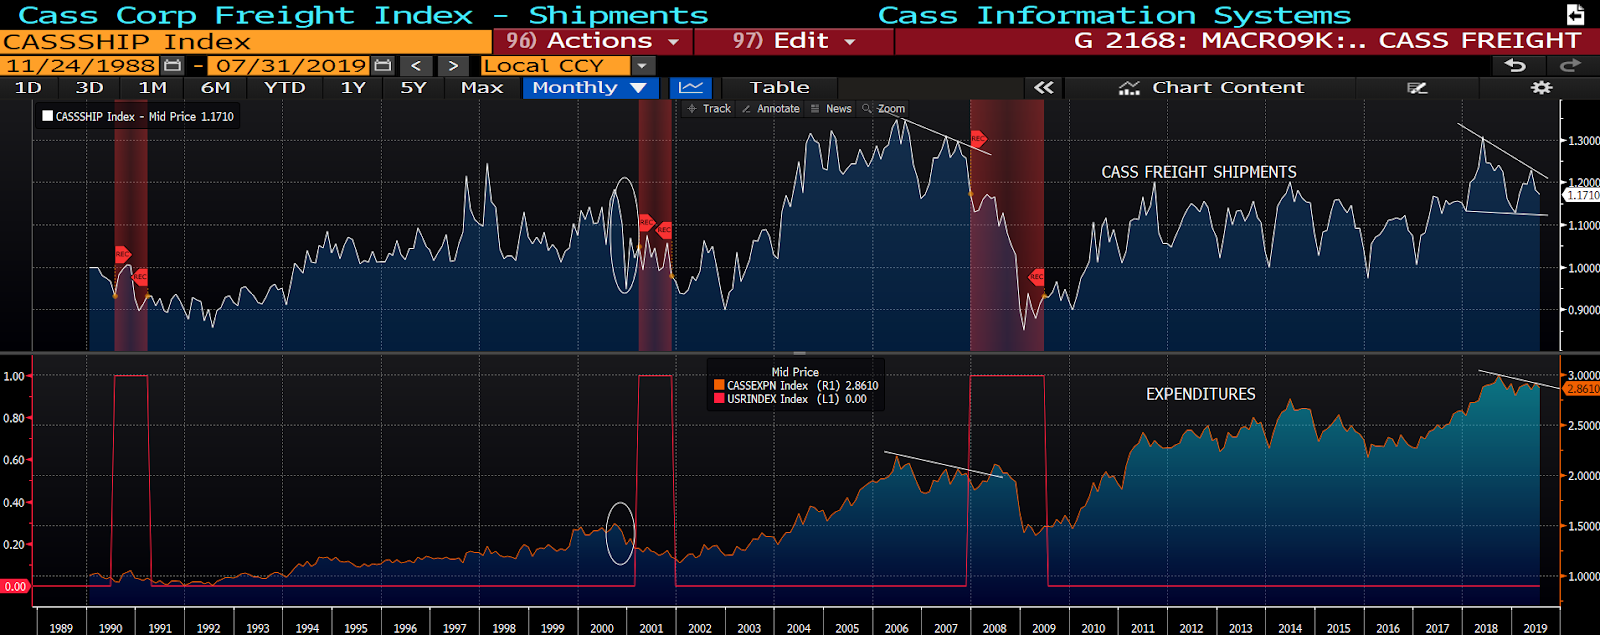
CASS Freight Shipments and Expenditures
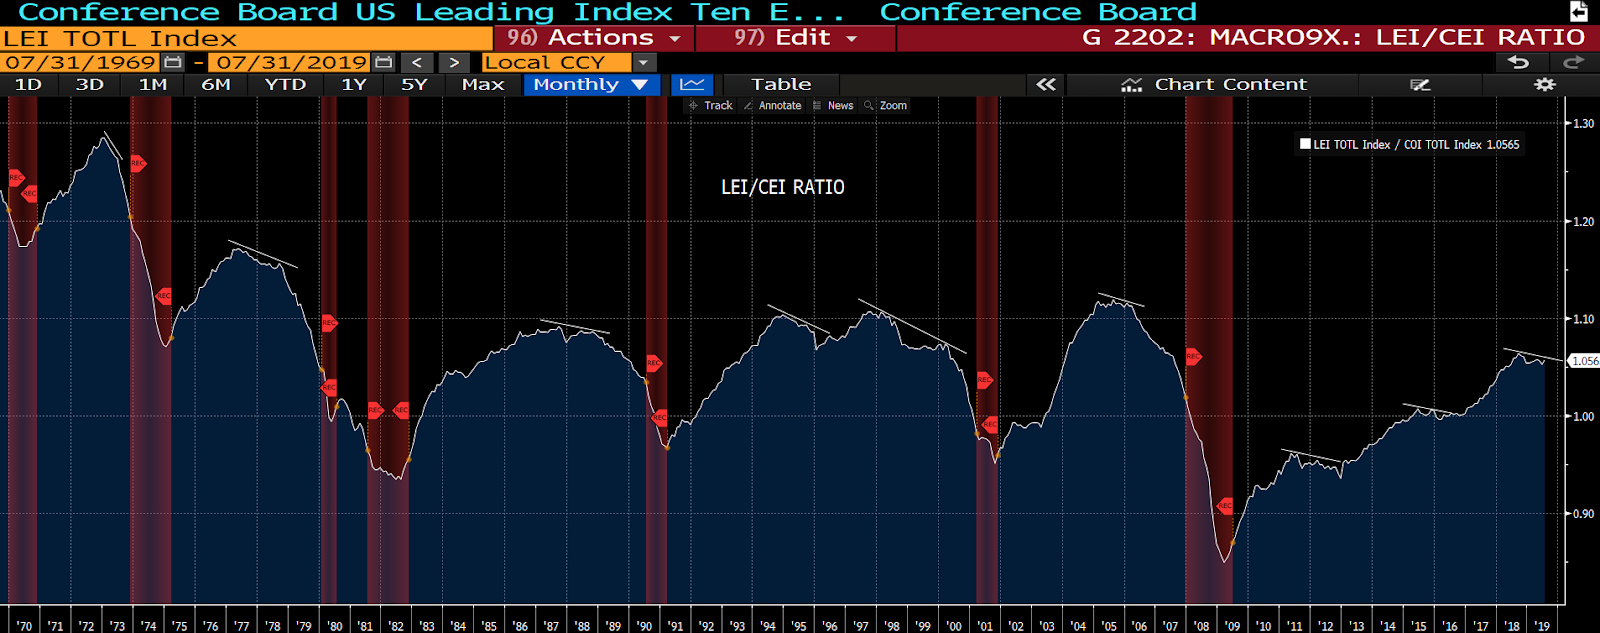
Leading/Coincident Economic Indicators (LEI/CEI) Ratio
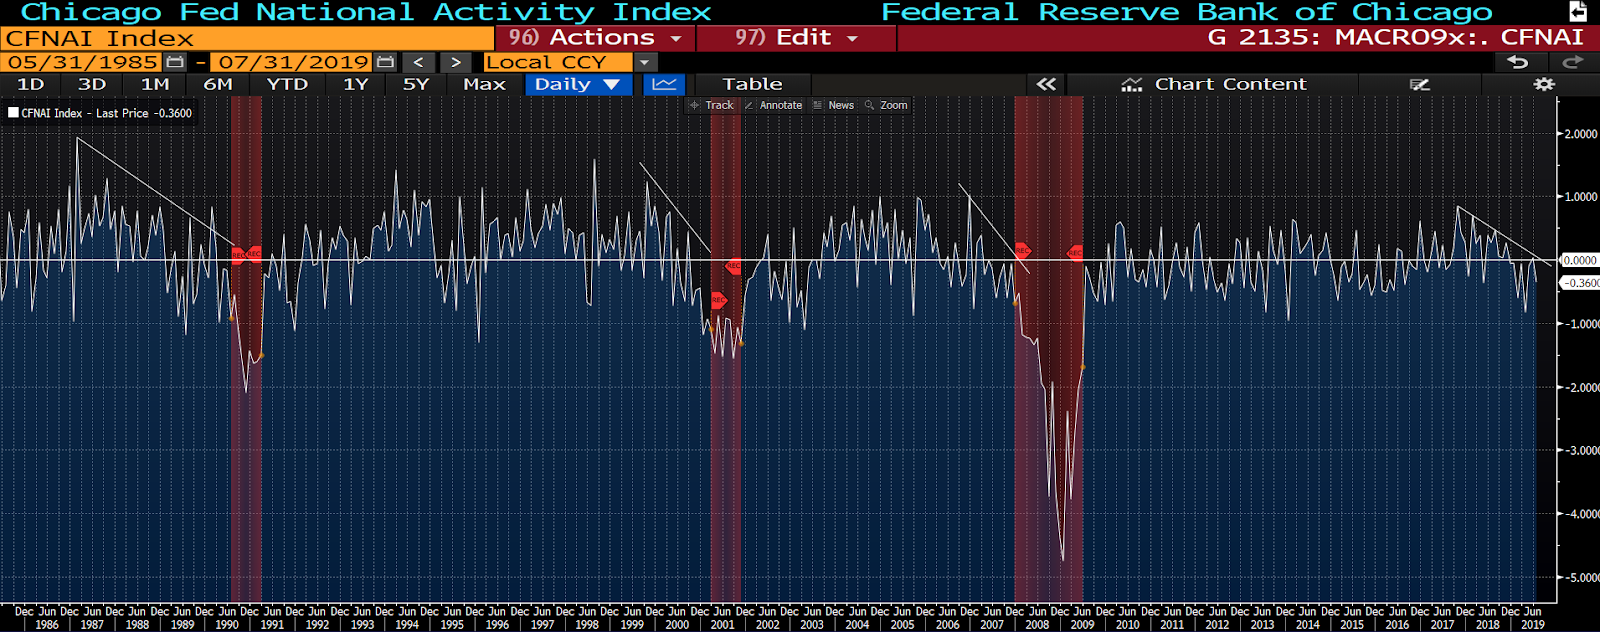
Chicago Fed National Activity Index
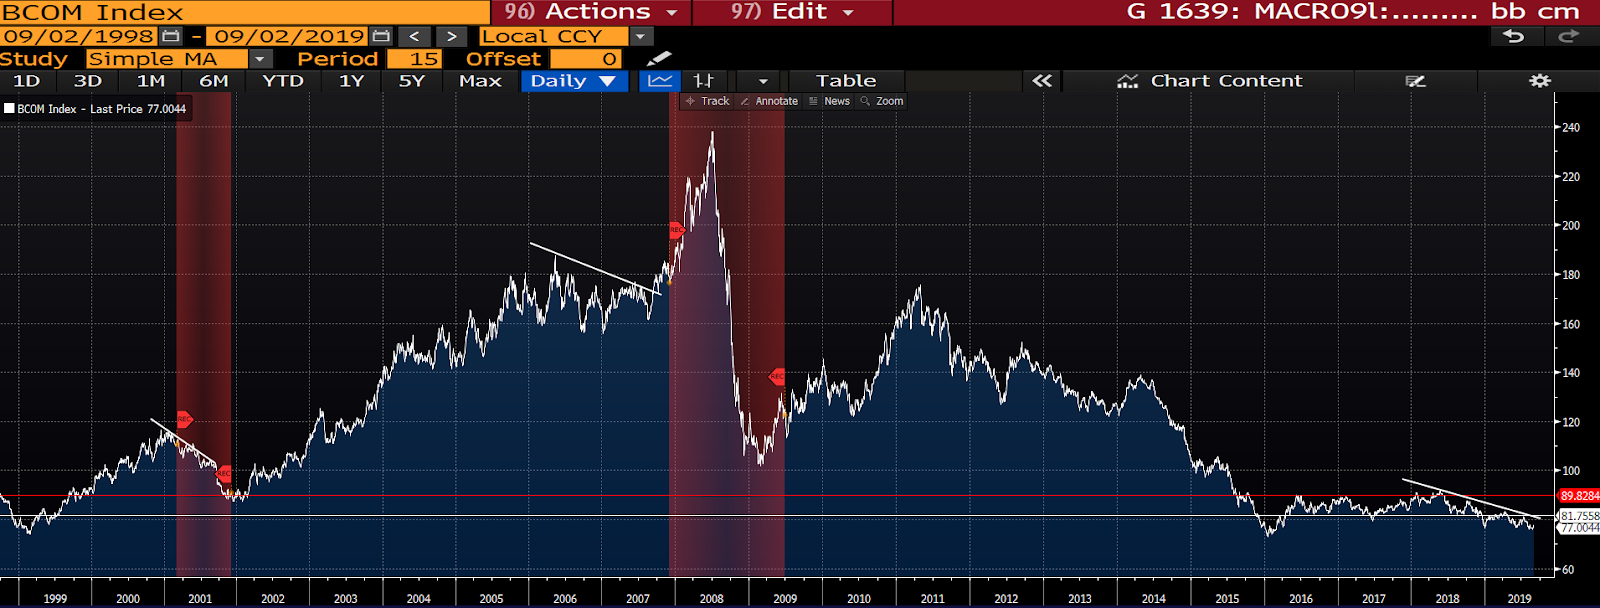
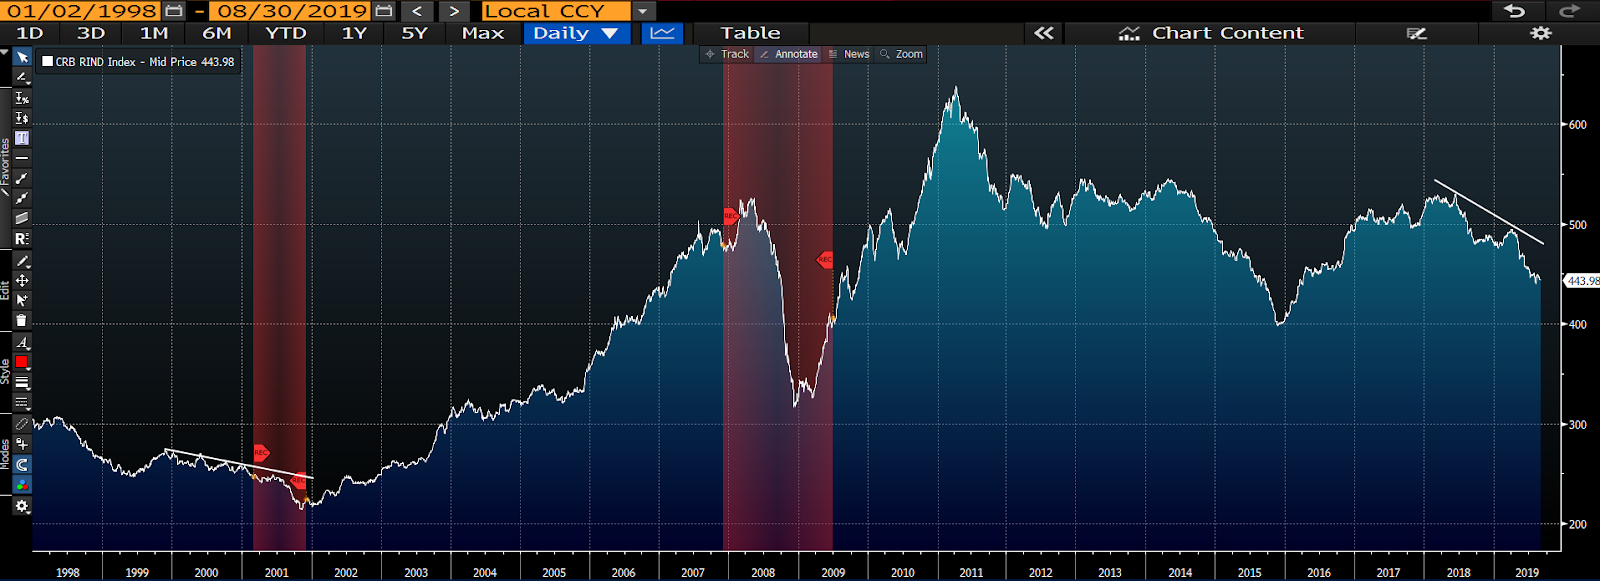
Bloomberg Commodity Index
Raw Industrial Materials
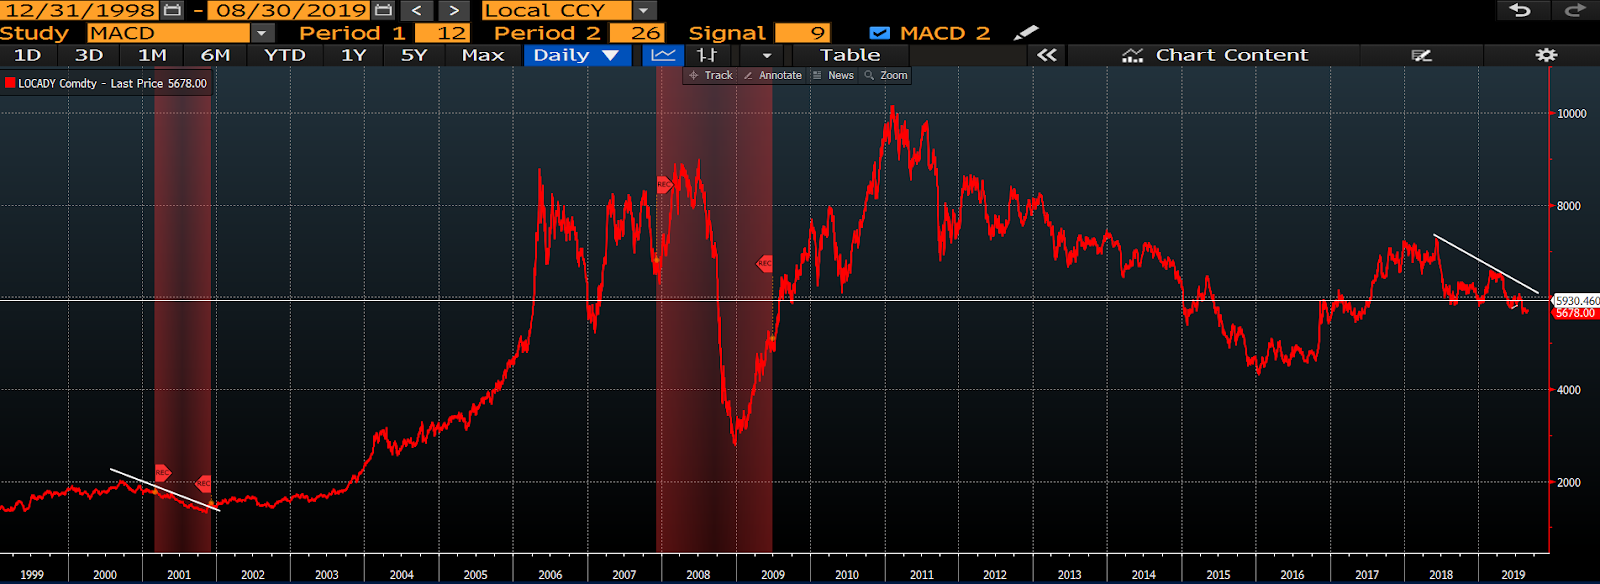
Copper
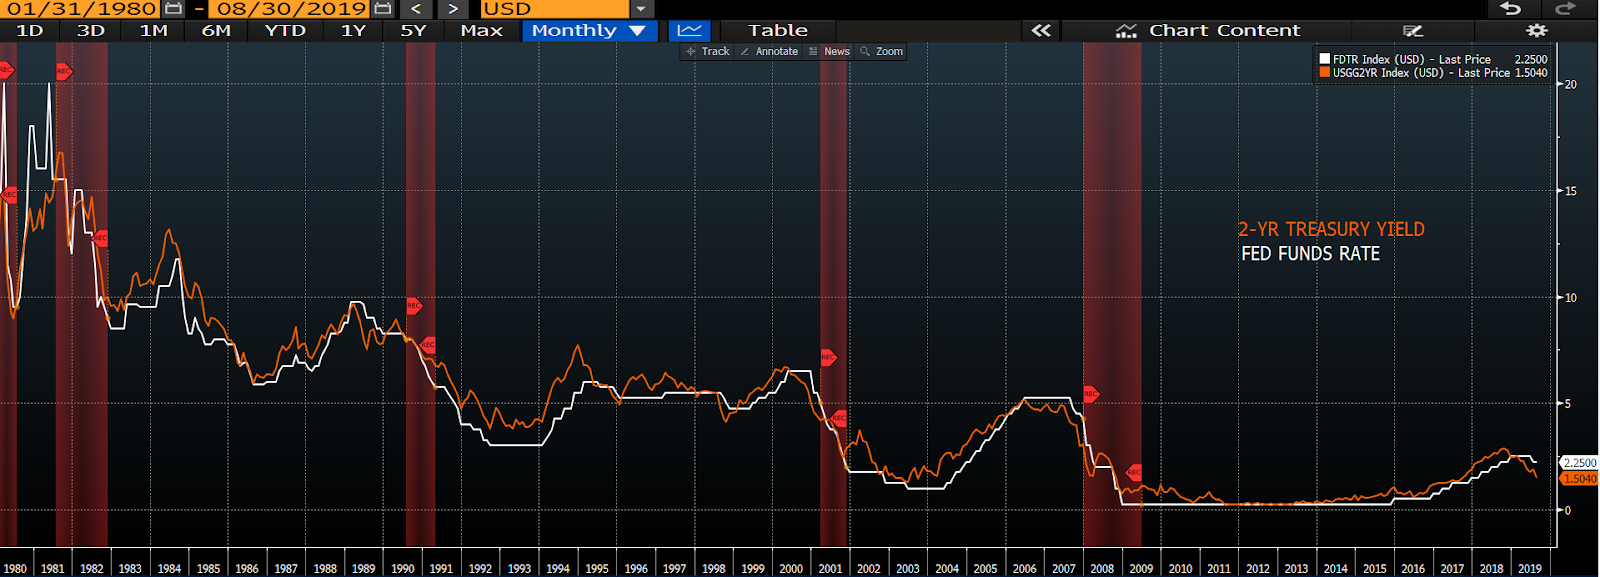
2-yr Treasury/Fed Funds Spread
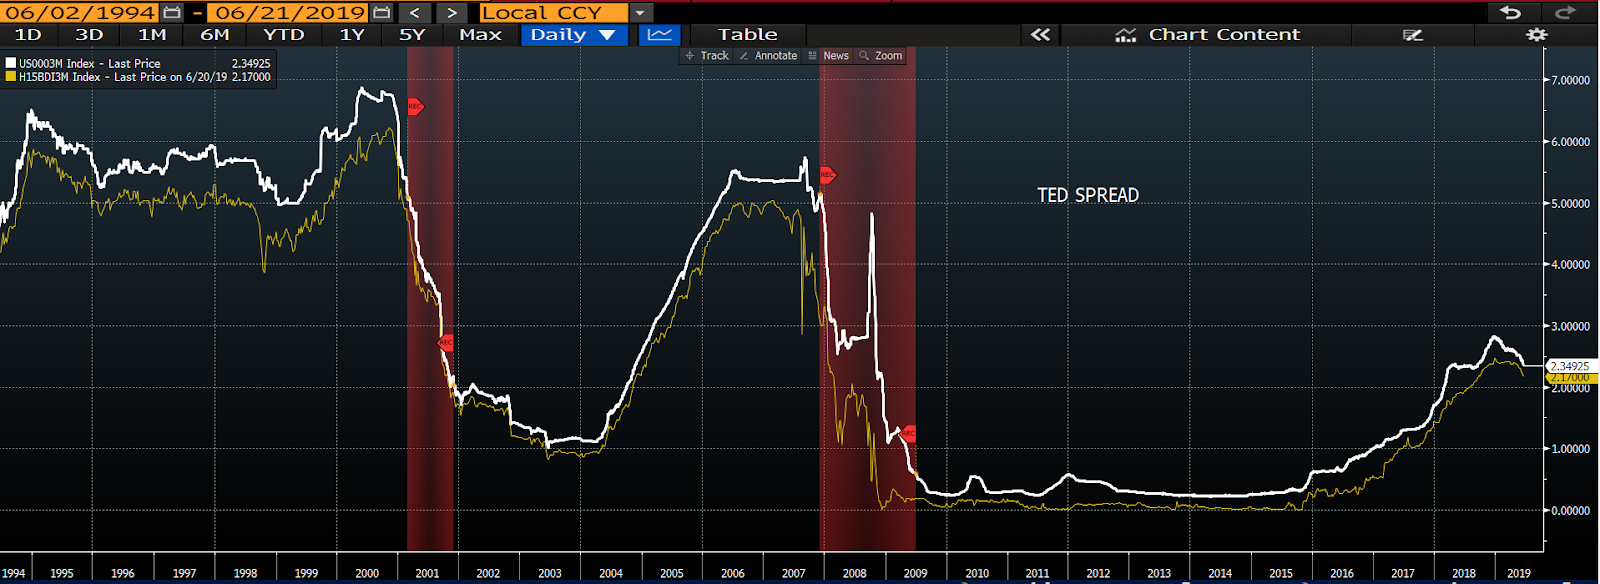
TED Spread
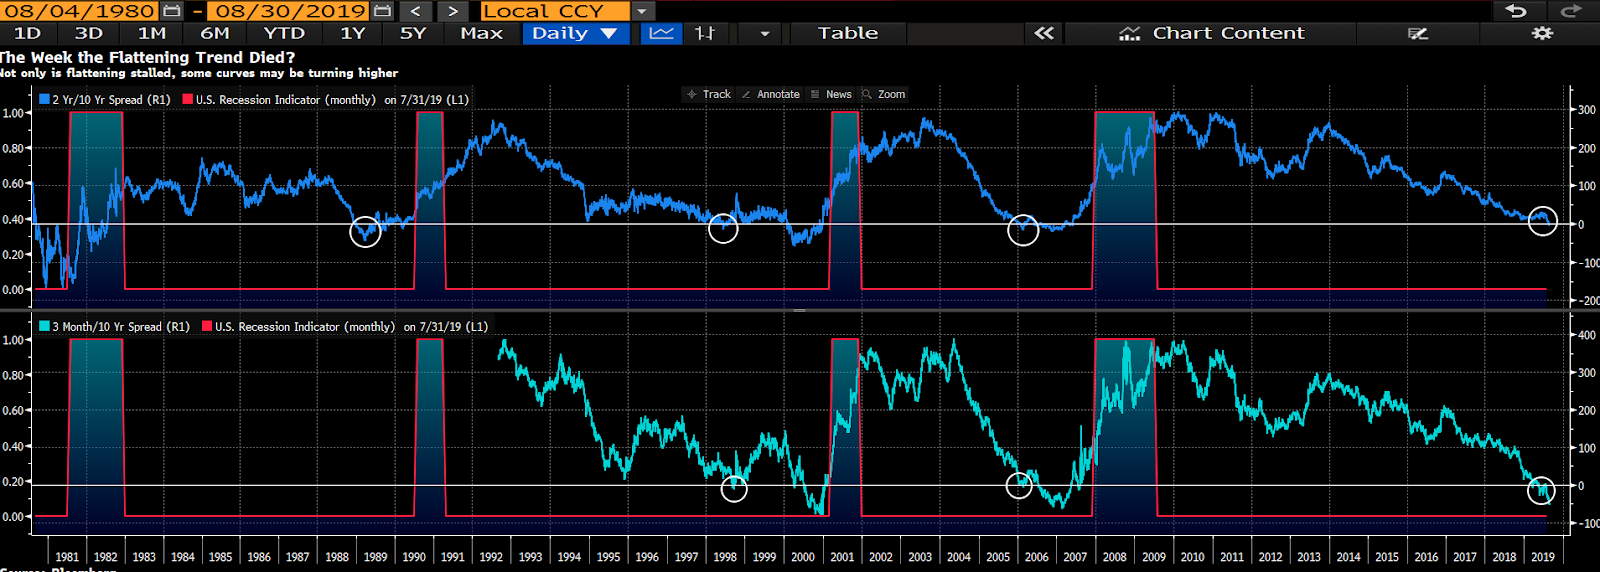
Treasury Yield Curve
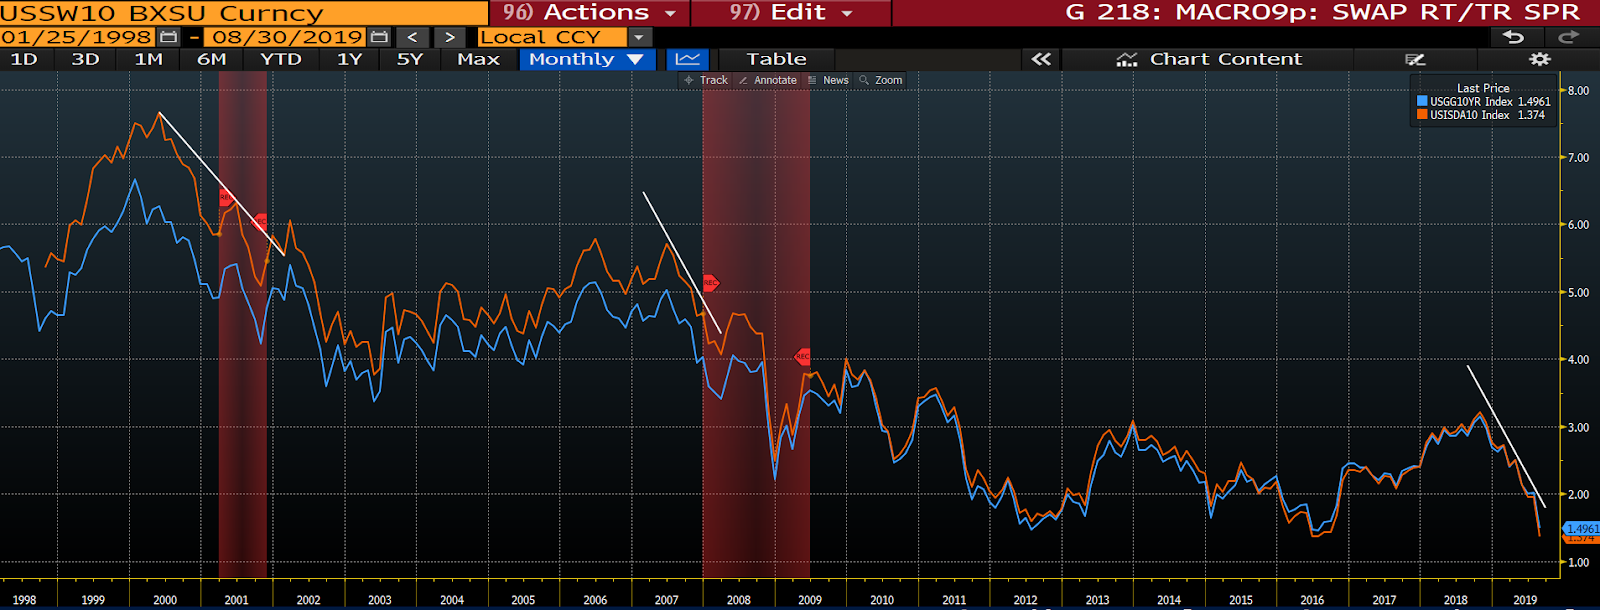
Swap Spread
This week’s overall macro score came in at -1.16, with 36% of our 86 indicators reading positive, 37% negative, and 27% neutral.
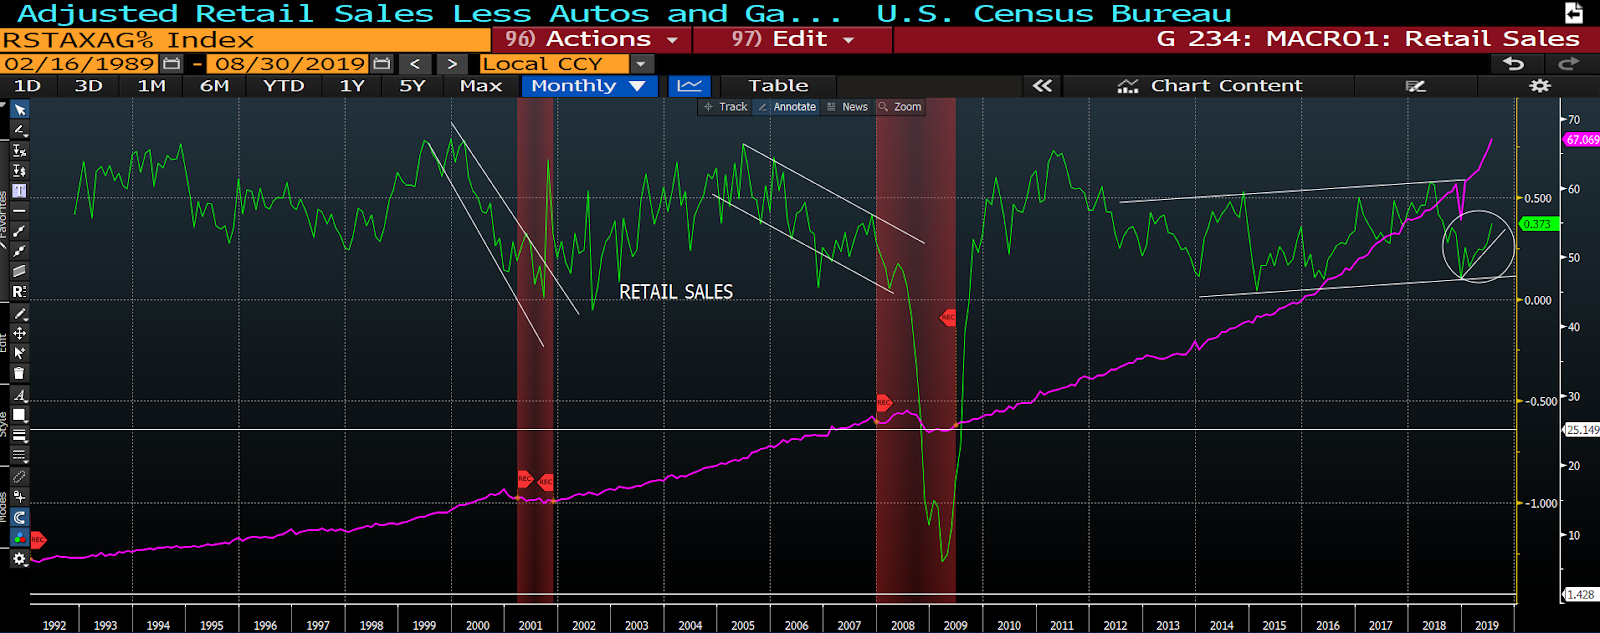
Now here’s the good news; 32% of the positive indicators showed up in consumer-related data, while only 6% of the negatives scored in the consumer column — and consumer spending accounts for roughly 2/3rds of U.S. GDP!
Check out our retail sales chart, for example (green = brick & mortar, purple = online):
Ok, so back to the not-so-good news; the consumer is pretty much all the economy has going for it these days.
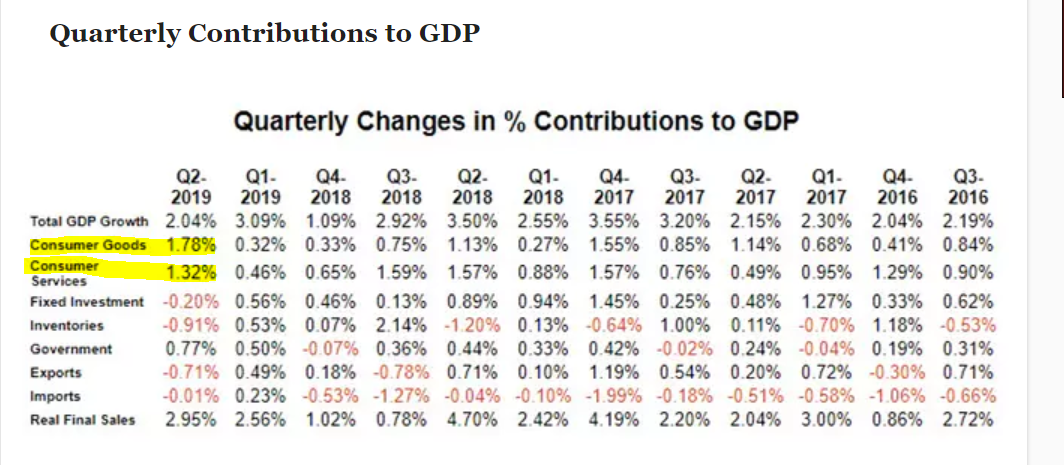
What the above table essentially tells is that the consumer was responsible for 3.10% of the 2.04% GDP growth last quarter. That’s right, save for government spending, everything else was a drag on the economy!
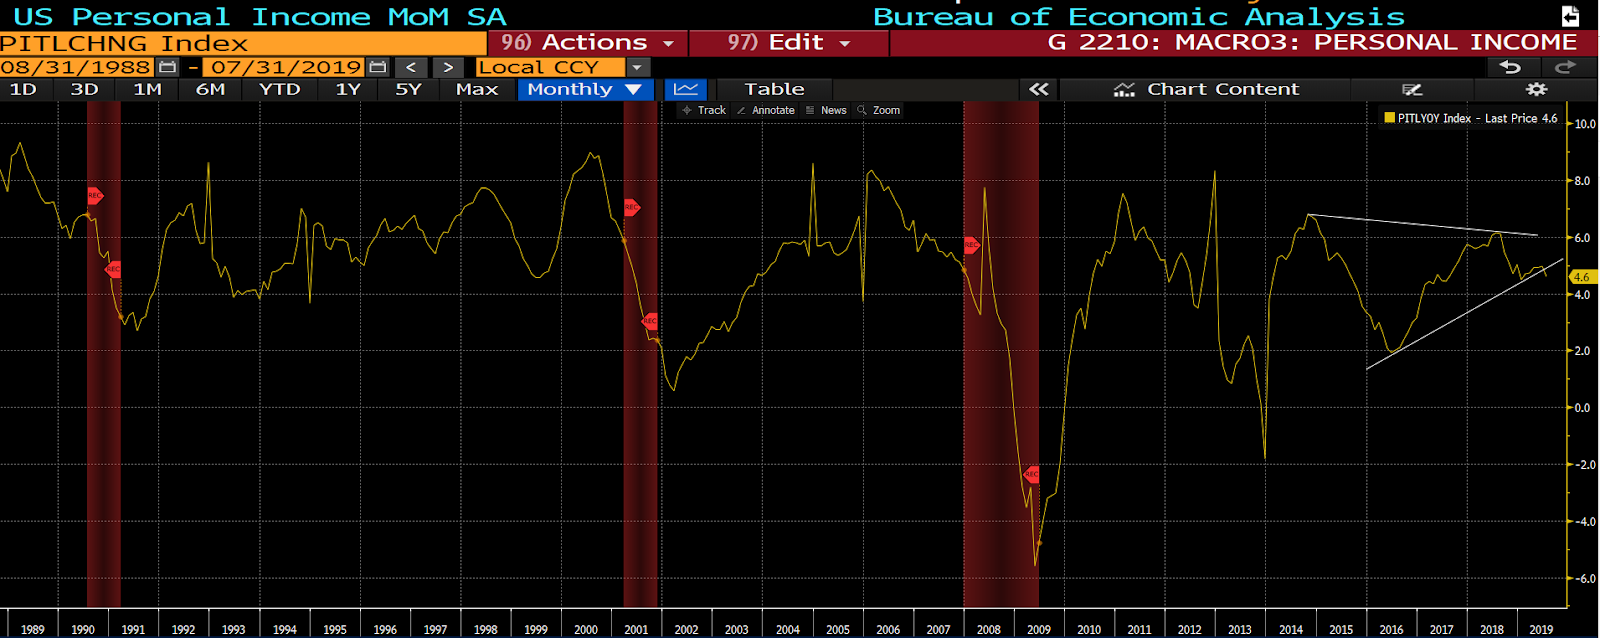
Hence, as we’ve been stressing herein, should the consumer pull back anytime soon we’ll indeed be staring down the next recession. And while the latest personal income numbers aren’t screaming recession, they’re not super inspiring either, and they’ll definitely need to pick up to support the pickup in spending. If, that is, we’re to view the increased spending as healthy (as opposed to debt-fueled unhealthy) phenomena:
U.S. Personal Income (month-over-month)
Stay tuned…
Have a nice weekend!
Marty