
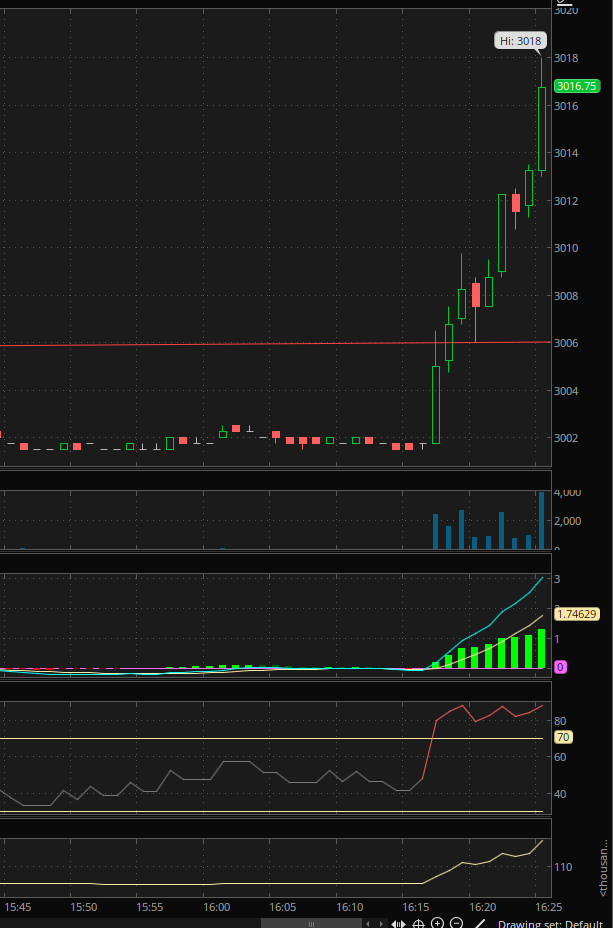
Here’s the 1-minute chart for the S&P 500 future contract as I type:
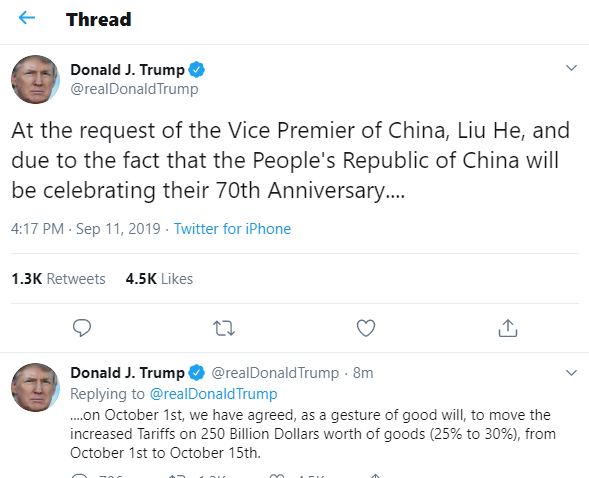
Here’s the tweet:
While this may indeed be the excuse that takes the S&P 500 to new all time highs (we’re really close already), remember, per our commentary of late, the charts were already hinting as much.
Now, suffice to say, if we do get there, it’s a pretty sure bet that it’ll serve to clear out most, if not all, of the shorts (traders betting on a reversal) sitting at or near the previous high; a process (shorts buying to cover) that’ll serve to add some oomph to what’ll appear to be (or ultimately will [sustainably] be) a bullish breakout.
If however, and alas, the longer-term charts/technicals (not to mention the fundamentals) play out as we’ve been illustrating herein, odds suggest that, at some point in the not too distant future, we’ll be characterizing the next few weeks/months as a classic “bull trap”. I.e., a sucking in of the unsuspecting late-comers who’ll get squeezed by the hedge funds, etc., who’ll be attempting to, well, squeeze out whatever this aging bull market has left in it.
All that said, I still maintain that, at this juncture, the economy, and, therefore, the stock market likely have yet another legitimate leg to run — in which case the bearish setup we’ve presented won’t play out — in a no trade war (between the U.S. and anybody!) scenario — if, that is, we get to that point in the relatively near future.
