

Take a look at the S&P 500 futures contract action from yesterday’s close to now (10 minutes before the open):
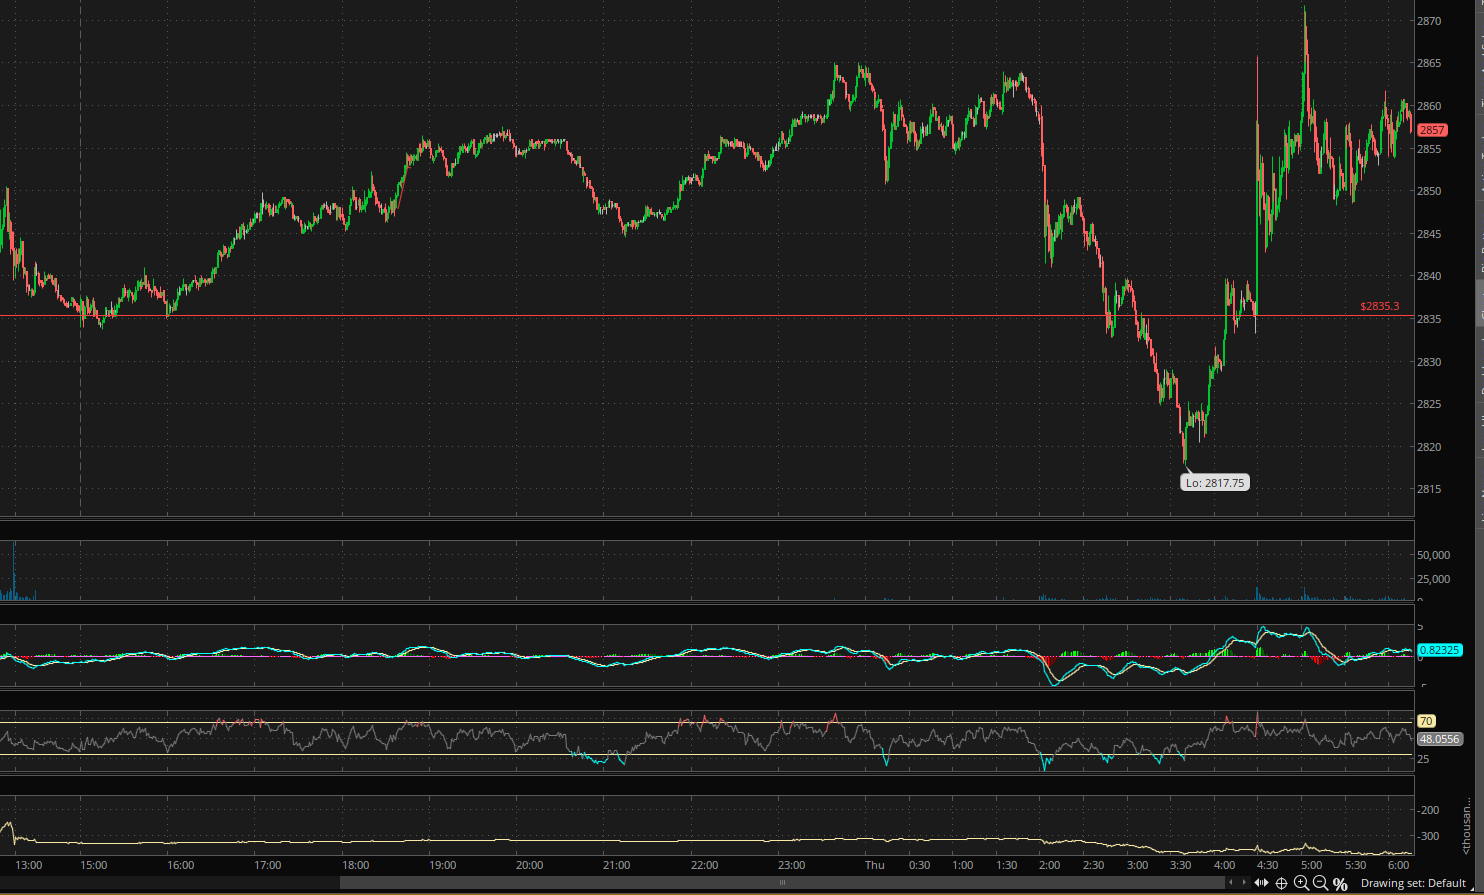
As you can see, stocks were working their way higher off of yesterday’s debacle, only to tank in the wee hours of the morning; which was sparked from news out of China that formal retaliation for the new round of tariffs announced by the U.S. two weeks ago is forthcoming. But then, lo and behold, roughly three hours before the open the S&P made an abrupt turn and rocketed higher.
The sudden upward spike was on another news flash out of China stating that they hoped that the U.S. would ultimately meet them in the middle on trade. That was all it took for the algos to kick in and buy like mad.
Interesting, and pardon my skepticism, but what essentially sounds akin to “you bruised me, now I’m going to bruise you back, but I hope that at some point we’ll stop bruising each other” doesn’t by itself inspire me to go rushing into stocks right here. But, then again, I’m not an algorithm programmed to trade on key words in a news headline…
Anyways, it’s going to remain very noisy, and very volatile, for quite some time; that you can bet on!
As we’ve made very clear herein, we are firm in our view that the bull market has no chance of surviving a protracted trade war with China, let alone with the EU. Vietnam, India, etc. (which all remains on the table).
So we wait, and we continue to crunch the data that matter.
From a technical perspective, while — to help you keep your head on straight amid the intraday volatility — I’ll continue to illustrate how the near-term shakes out, I also want to, from time to time, share the longer-term technical picture (setup) to help you understand my prevailing bias, be it bullish or bearish.
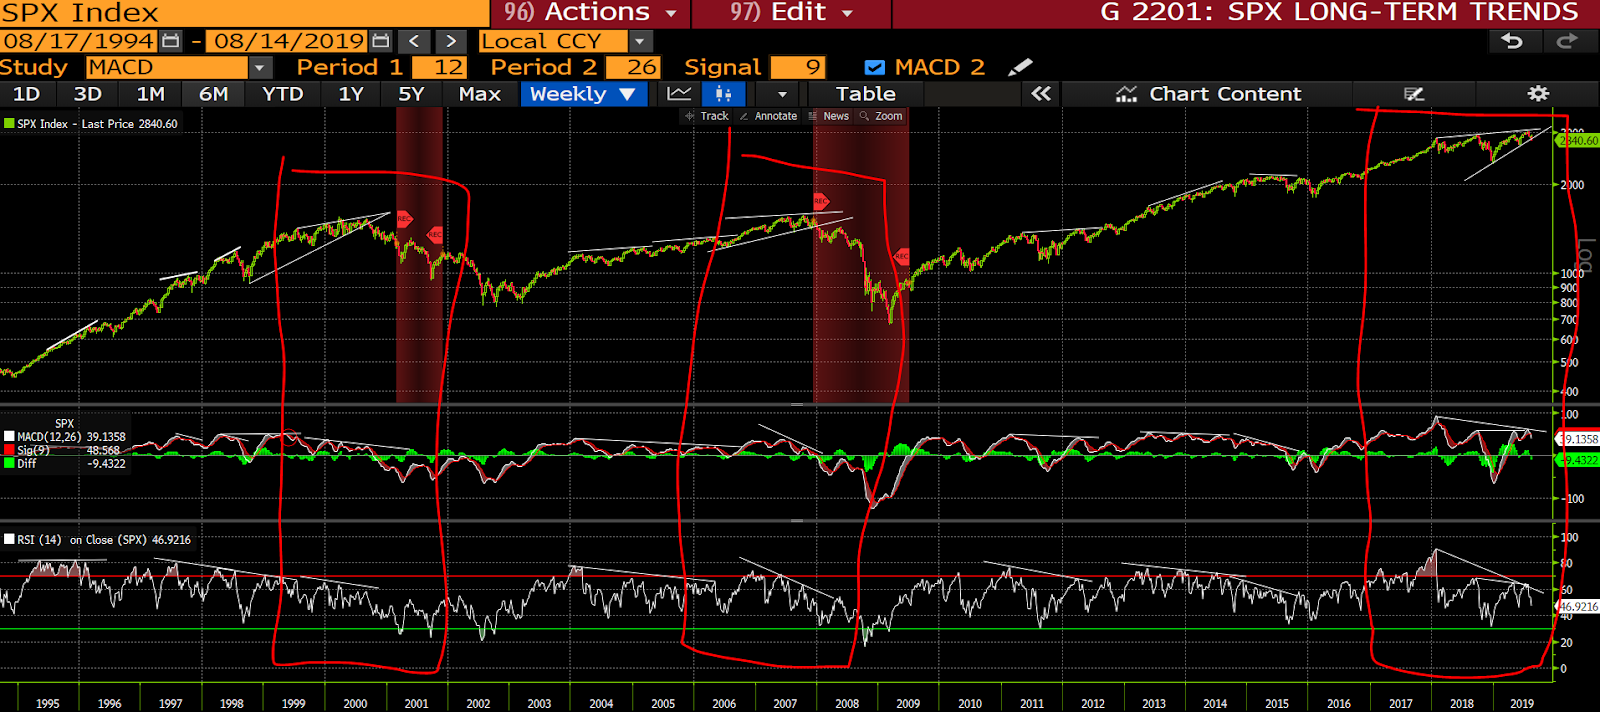
Here’s a bit of what has me presently sounding bearish: click any insert below to enlarge…
S&P 500 weekly chart (top panel) and two of the momentum indicators we track (red shaded areas highlight the last two recessions):
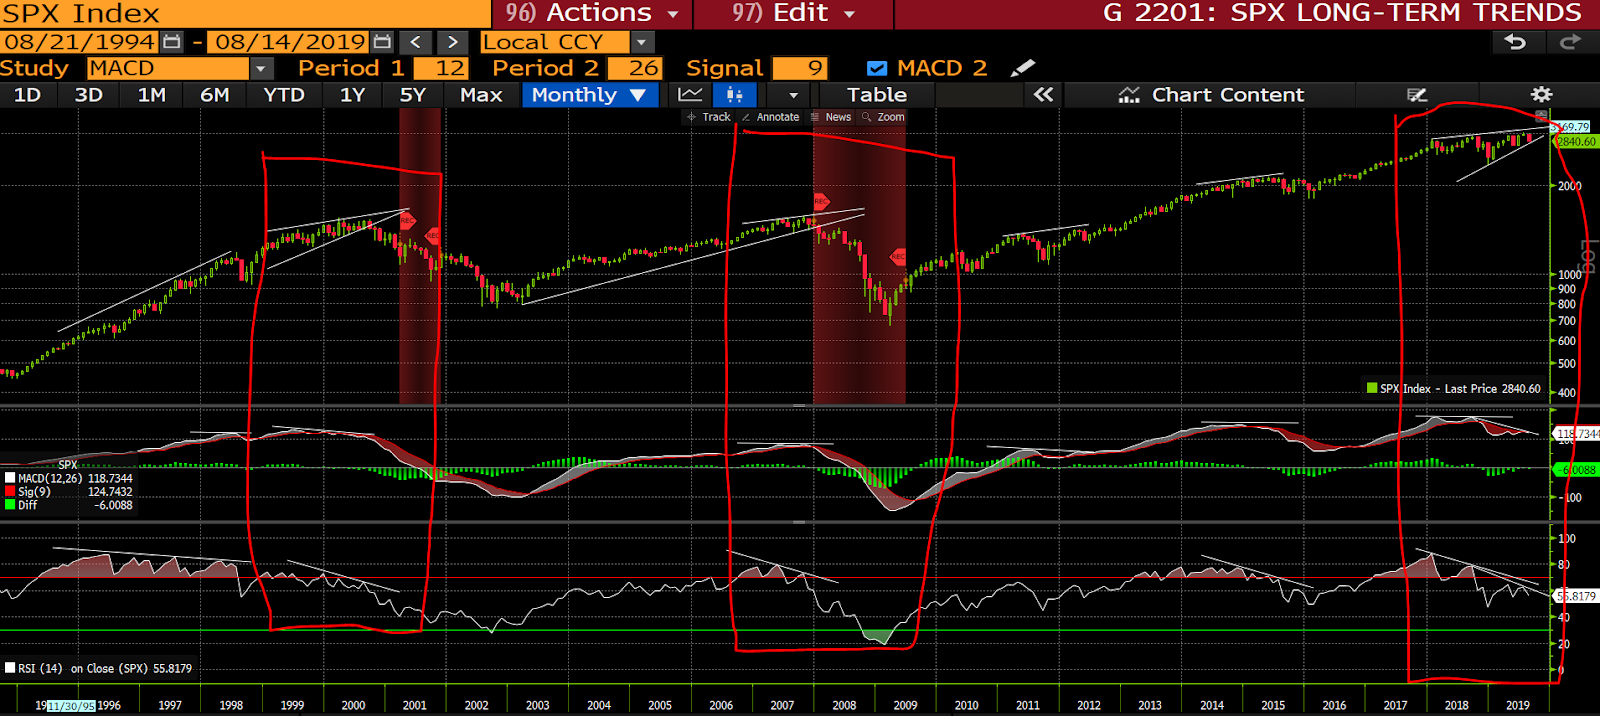
Monthly:
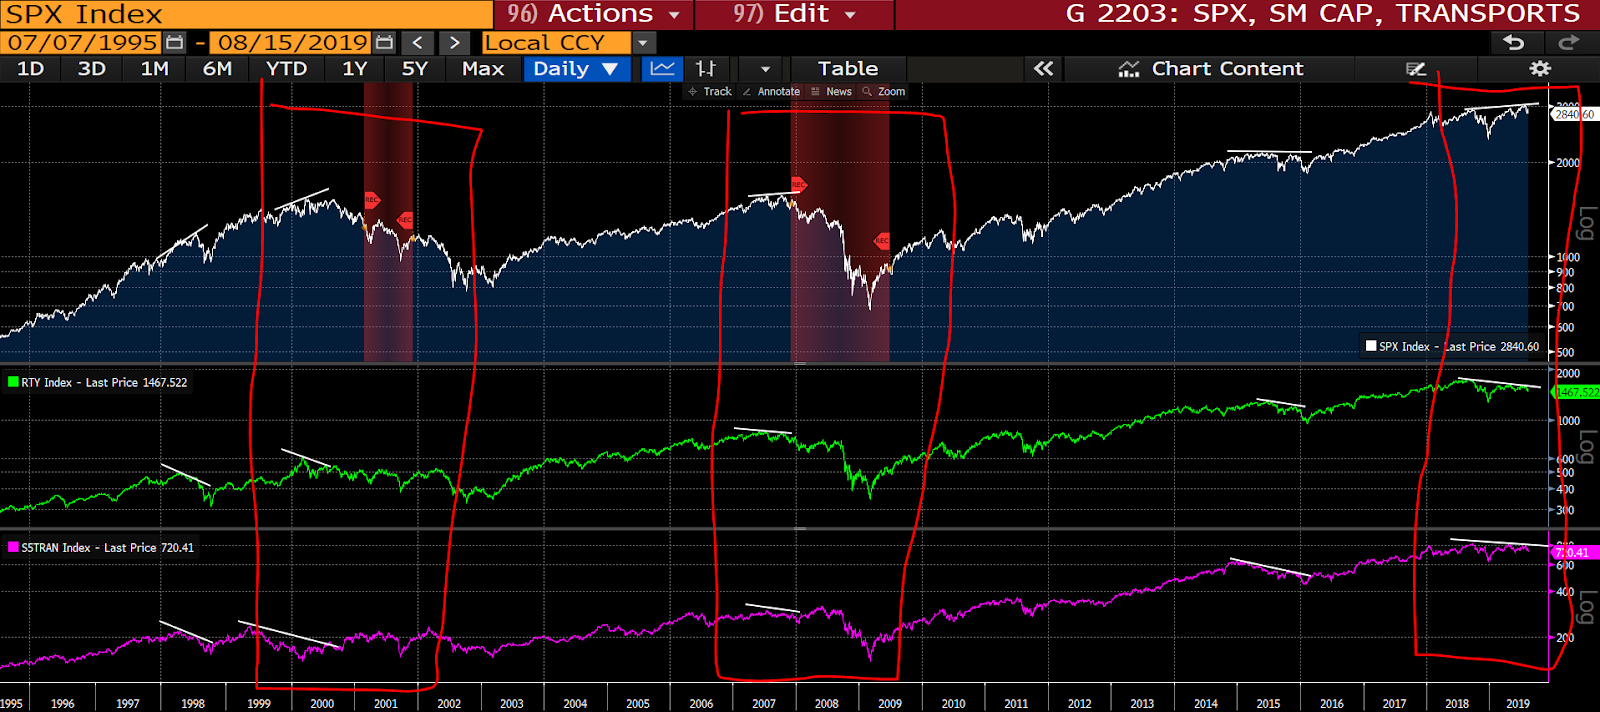
The S&P 500 vs economically-sensitive smallcap and transportation stocks:
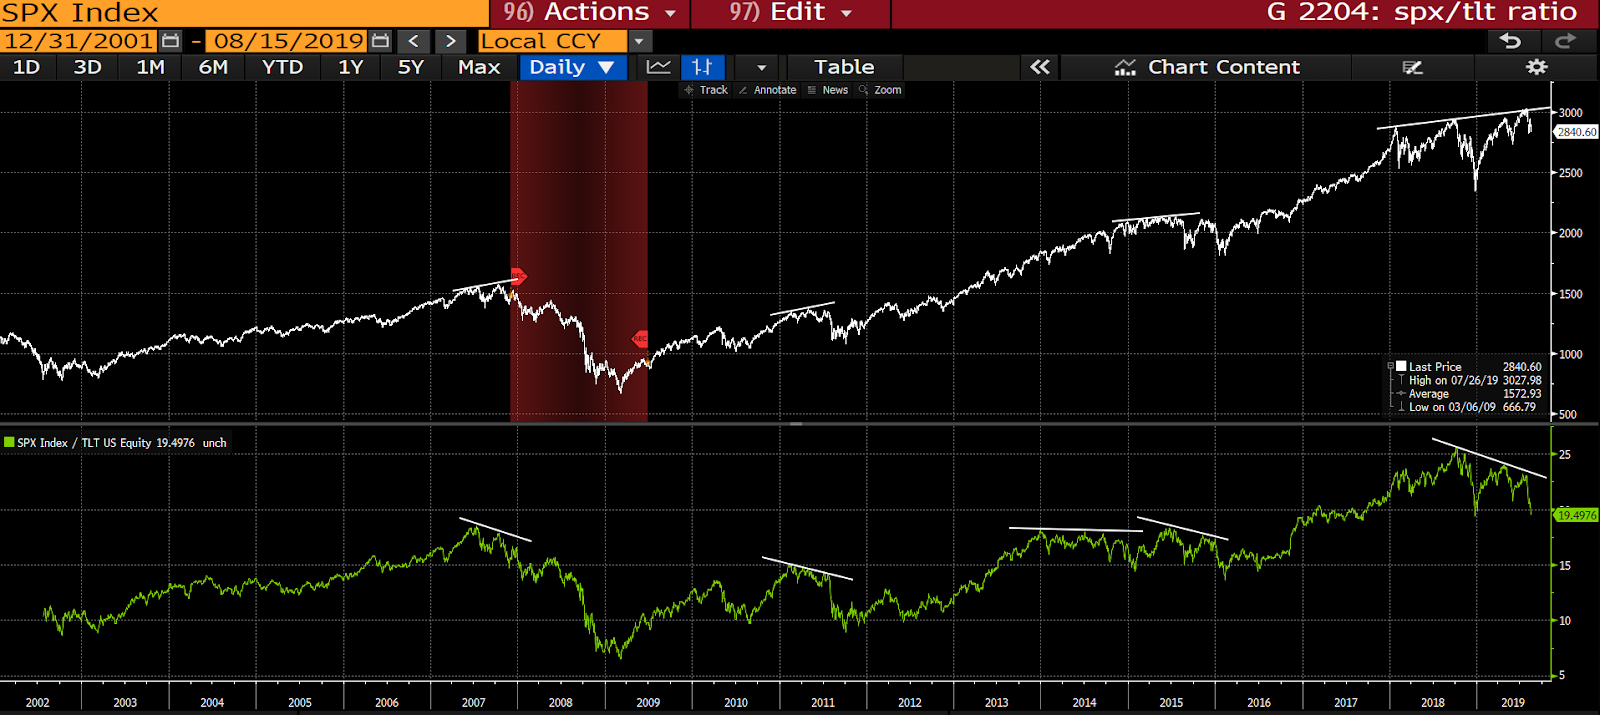
The S&P 500 vs the SPY/TLT ratio (stocks/bonds ratio); falls when bonds outperform stocks:
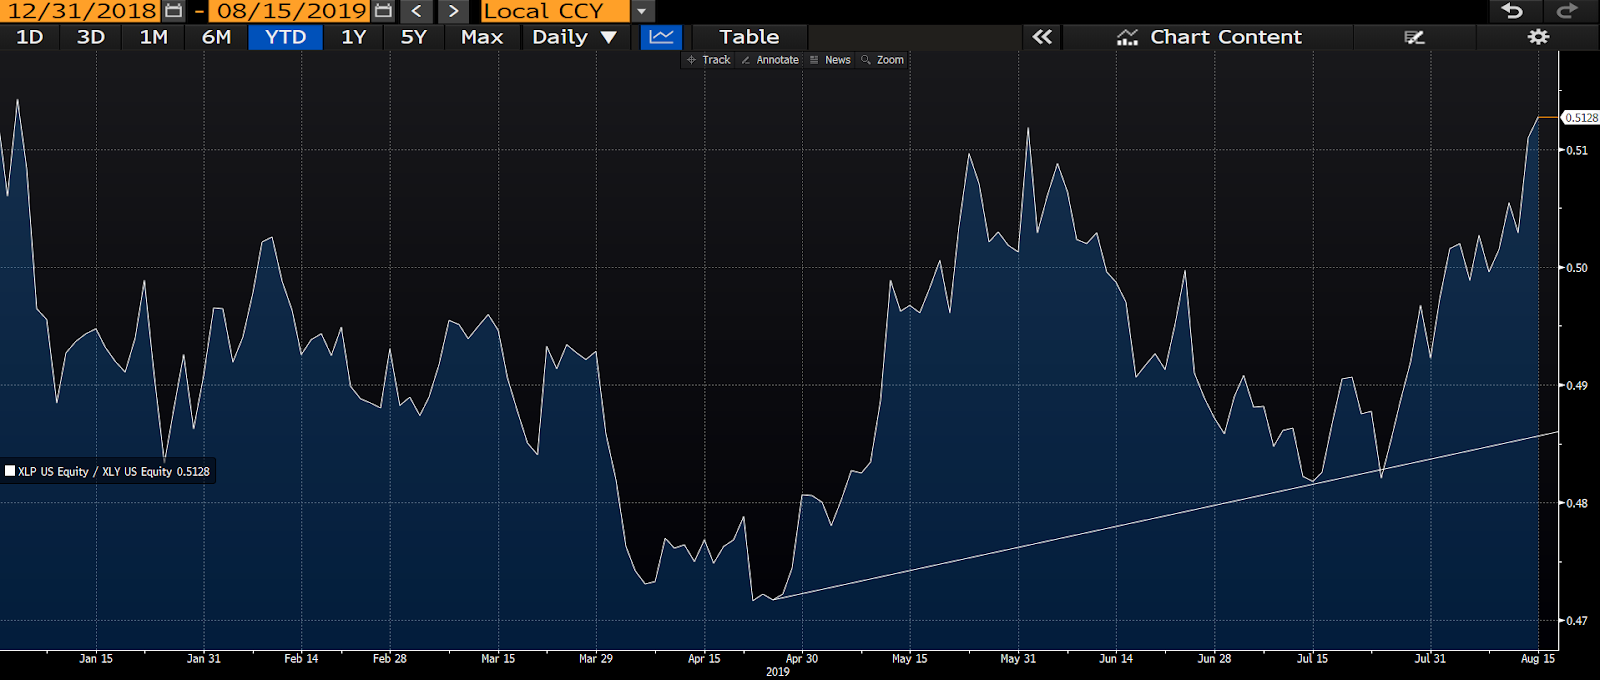
The staples stocks/discretionary stocks ratio (year-to-date); rises when economically-defensive stocks outperform cyclical stocks:
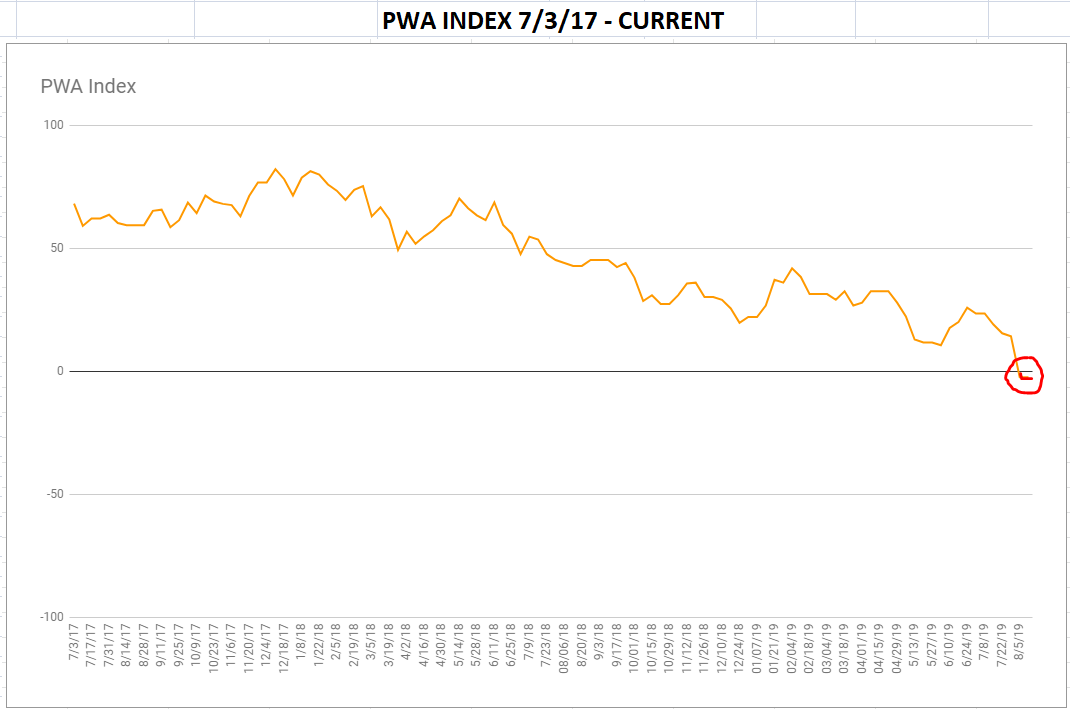
Fundamentally-speaking; here’s a graph of our proprietary macro index since inception:
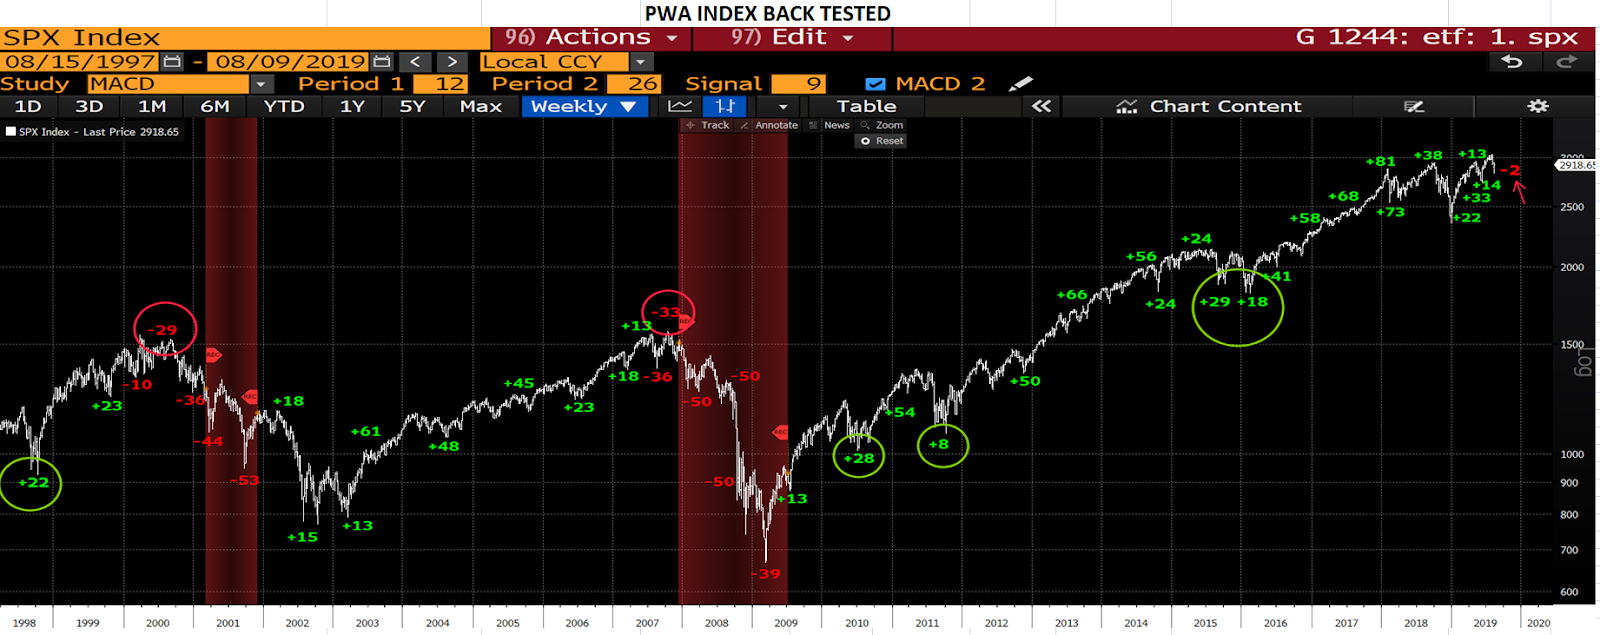
Here are our index scores against the S&P 500, backtested over the past 20 years (at key points in time):
So, now you know what I meant when I said in a recent video that
“There’s a lot of technical and fundamental damage that needs repairing before we can begin talking about new, sustainable, all time highs.”
Or words to that effect…