
At the beginning of each week we update a variety of technical and fundamental indicators/data as our way of monitoring market and economic conditions. We often share our interpretations herein.
Along with dozens of individual data points, we also leverage the work of other analysts who parse much of the same data and offer up their assessments in the form of what are termed financial stress indexes. The three we include in our weekly tracking are the Kansas City Fed Financial Stress Index, The St. Louis Fed Financial Stress Index and the Chicago Fed Financial Conditions Index.
There’s a bit of overlap among the three, as each is attempting to present the best, most empirical/useful measure of existing stress in the system possible. For example, each tracks the TED spread (3-month LIBOR/3-month t-bill spread), the High Yield Credit Spread (10-yr junk bonds/10-yr treasury spread), the S&P 500 Volatility Index (VIX), swap spreads, and two of the three track the 2s/10s treasury yield curve (we track each of these factors separately as well).
(By the way, all you need to know about credit/treasury spreads is that they signal how fixed income players feel about present market conditions. When they’re concerned about credit conditions in the marketplace they demand more [higher yields] from non-government backed debt. Hence, when they’re worried, those spreads [the difference between the yield on a given non-insured instrument and a government backed security] widens.)
Each uses zero as its baseline. An index moving upward, and above the zero line, denotes an unusually high level of stress in the financial system, serving as warning of increasing recession risk. A reading below the zero line suggests normal, or low, levels of stress.
The question of course is, do they work? Do they indeed offer up warning signs ahead of recessions? Well, we can of course only answer that question in retrospect. Here’s a 30-year look:
click any insert below to enlarge…
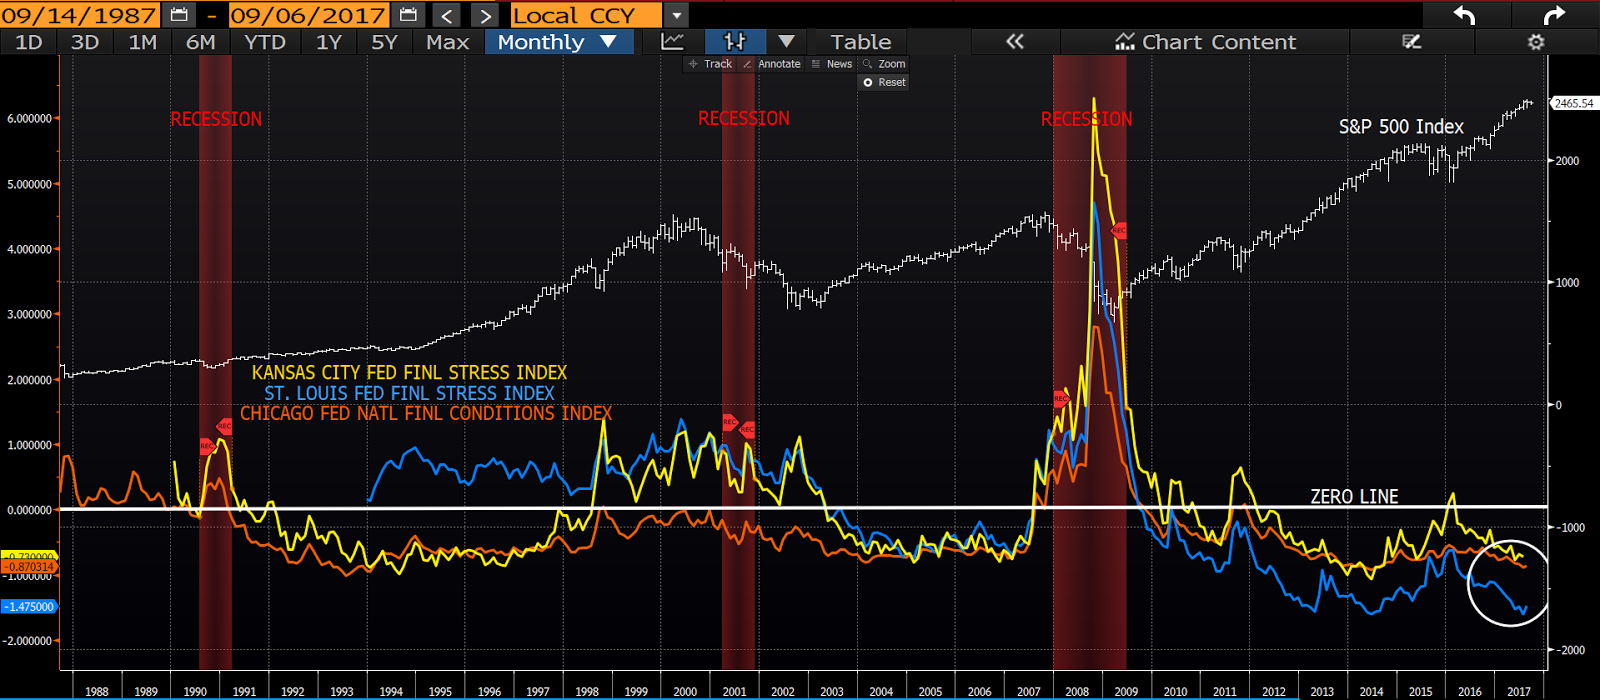
Yes, while the Kansas City Fed Index is composed in a manner that apparently makes it more sensitive to equity market conditions versus the other two (per its two breaches of the zero line during the present expansion), they are without question legitimate recession indicators. And, per the circle, we — for now — are living in a (historically) low-stress environment.
Ah! But you wouldn’t know it by the action in gold (that safe haven) of late. Here’s a 2-month chart:
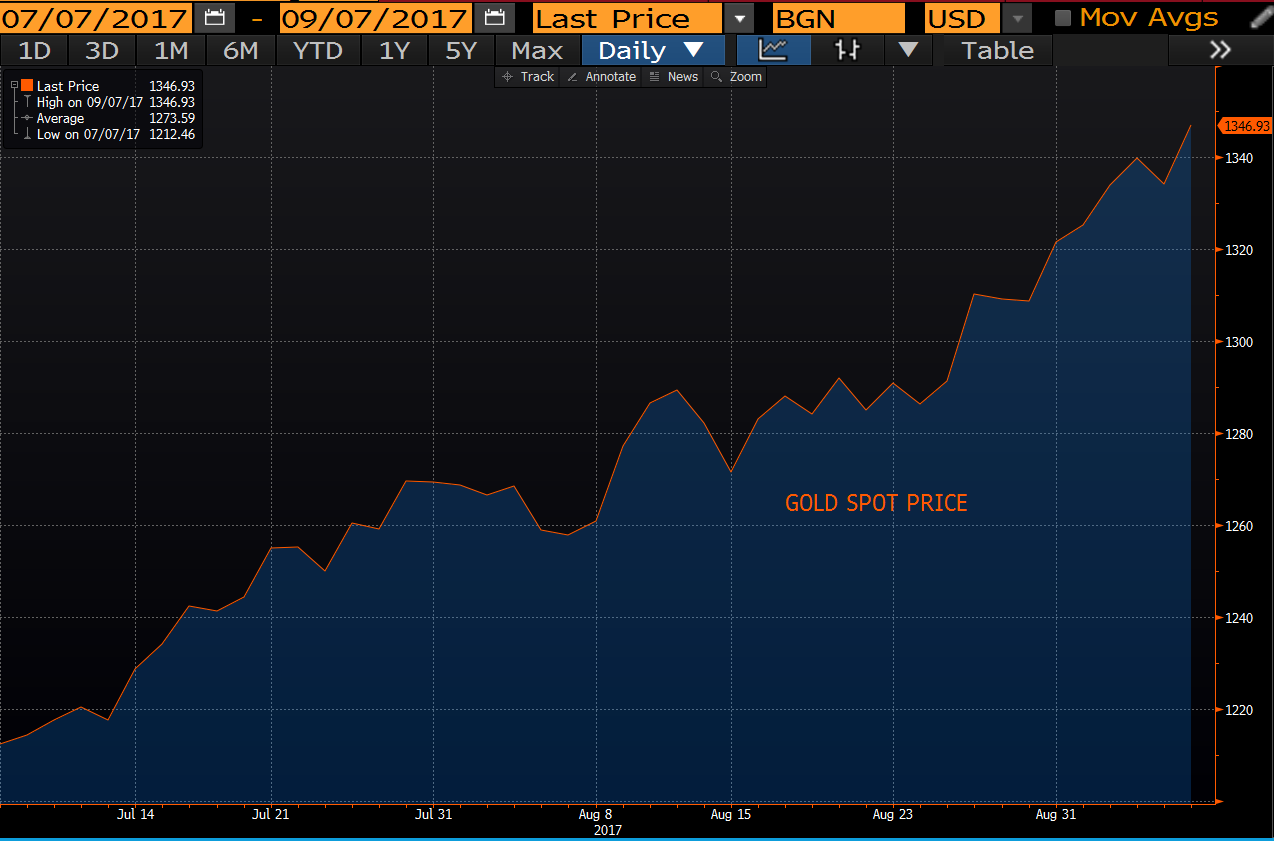
Dang!
Now, folks generally (well, let’s say sometimes) buy gold when they fear the future. So maybe it’s North Korea, or the threat of the globally-connected U.S. becoming, well, globally-disconnected — a la the recent threats of protectionism. If so, the yellow savior is flying higher smack in the face of a stock market (although gold and stocks can/have move/d in the same direction when inspired by the same factors, such as falling interest rates) — not to mention economic data — that says North Korea is simply what it’s always been, and that, no!, U.S. policymakers are ultimately not interested in risking the nation’s global clout (and mutually beneficial relationships) under their watch. Here’s a 5-year look (as of the end of last year) at gold versus the S&P 500:
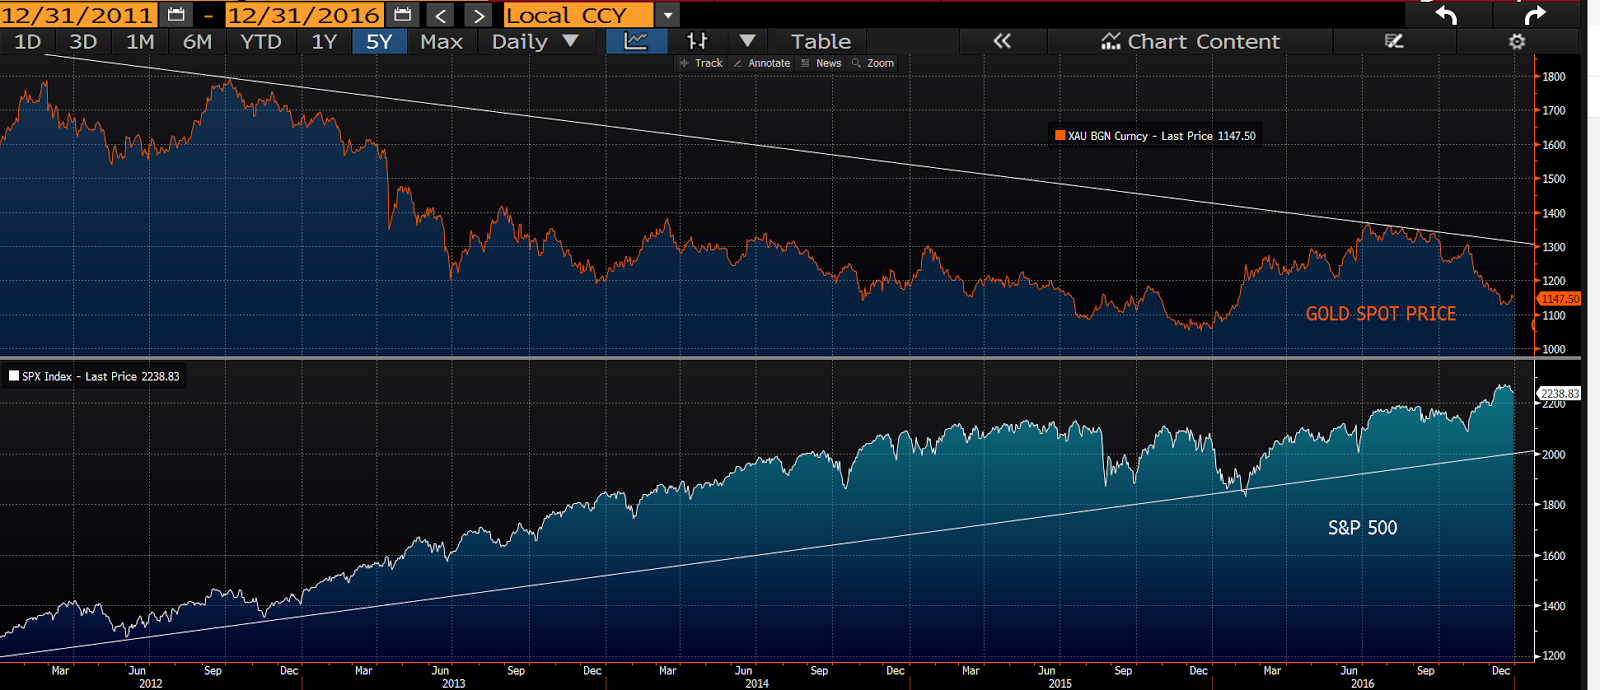
And here we are year-to-date:
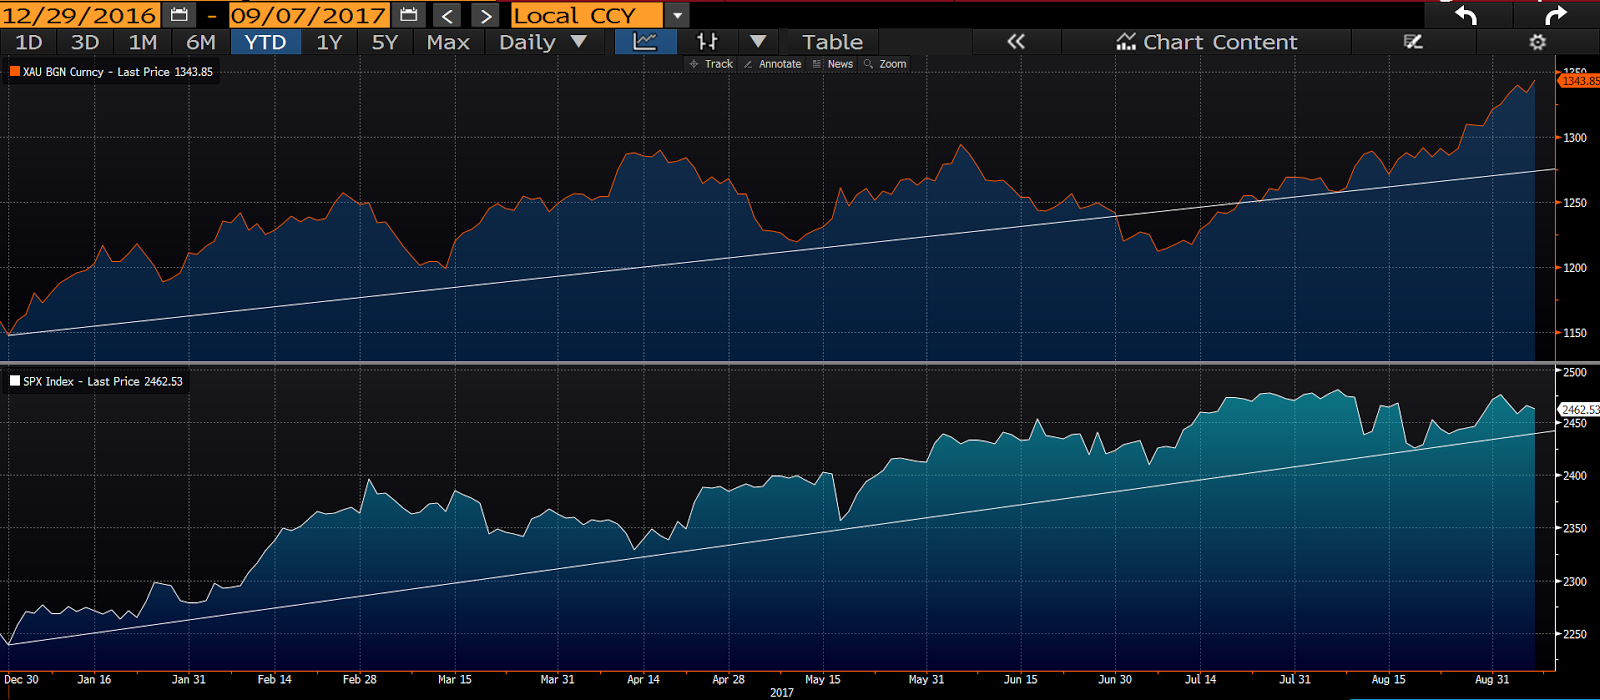
So what gives? Why is gold rising while stocks appear locked in a strong bull market? Are they indeed presently inspired by the same developments?
I’d say no. I’d say that the more recent sustained upward pressure on gold is more about a dovish Fed and a weaker dollar than it is fear of nuclear war (although we’ve had brief periods this year where I felt gold was indeed a fear trade). And that the stock market is riding primarily on a strong macro economic backdrop, positive earnings growth, and, believe it or not, pent up demand for stock ownership.
Essentially, therefore, if gold has it right, ultimately, the stock market has it wrong. Meaning, for the Fed to remain dovish and the dollar to continue to trend lower, the global backdrop we’ve been illustrating herein isn’t long for this world. Or, conversely, if the stock market has it right and gold has it wrong, ultimately, the Fed will nudge rates higher and the dollar’s descent will stop dead in its tracks. In which case, the current rally in gold is on very shaky ground.
To illustrate, here’s the mirror image of gold and the dollar over the past 12 months:
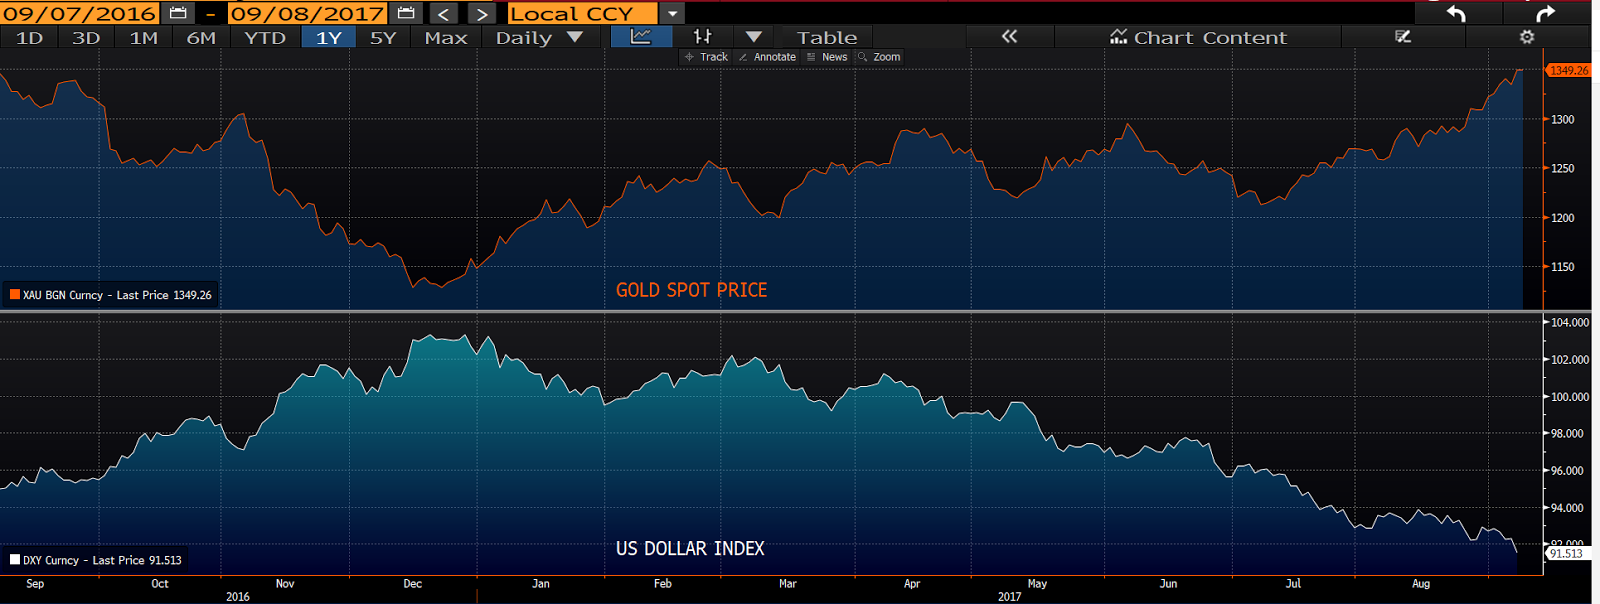
Something’s gotta give!
We’ll keep you posted…
Have a great weekend!
Marty
P.s. Here’s what’s behind those stress indexes:
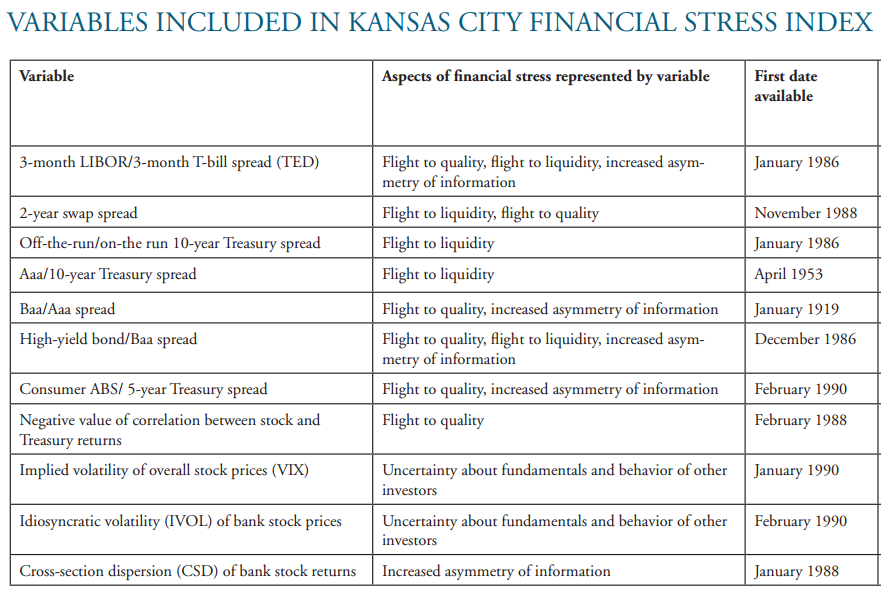
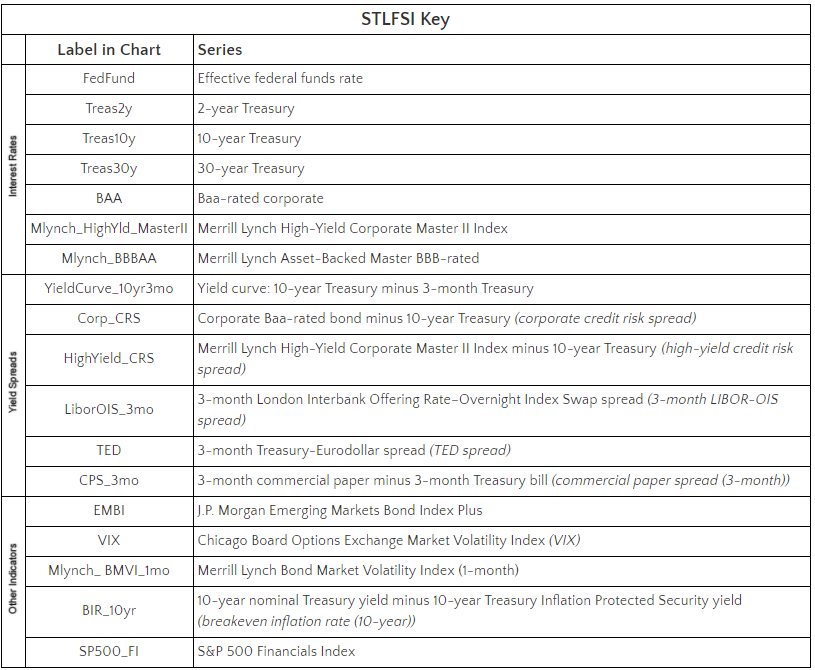
…. the NFCI is a weighted average of a large number of variables (105 measures of financial activity) each expressed relative to their sample averages and scaled by their sample standard deviations.
