

In part 2 of this week’s look at the economy, we’ll highlight a few key indicators that point to the general state of business in the U.S.
The following charts (click to enlarge) go back as far as the data allow. Note the trends leading into past recessions (red-shaded bars) and compare to the present. I highlight each title green, yellow or red to reflect my view of the prevailing trend.
Inventory to Sales Ratio

This one’s a little tricky. One might argue that a rising inventory to sales ratio speaks to forward optimism among businesses. However, it can also speak to lower-trending sales. In general, you want to see a low, or descending, ratio. When the economy is growing and spending picks up against low inventories, production has to expand, which creates jobs, improves wages and, thus, increases demand; a virtuous cycle, if you will. The recent downward trend is good news.
Corporate Financing Gap
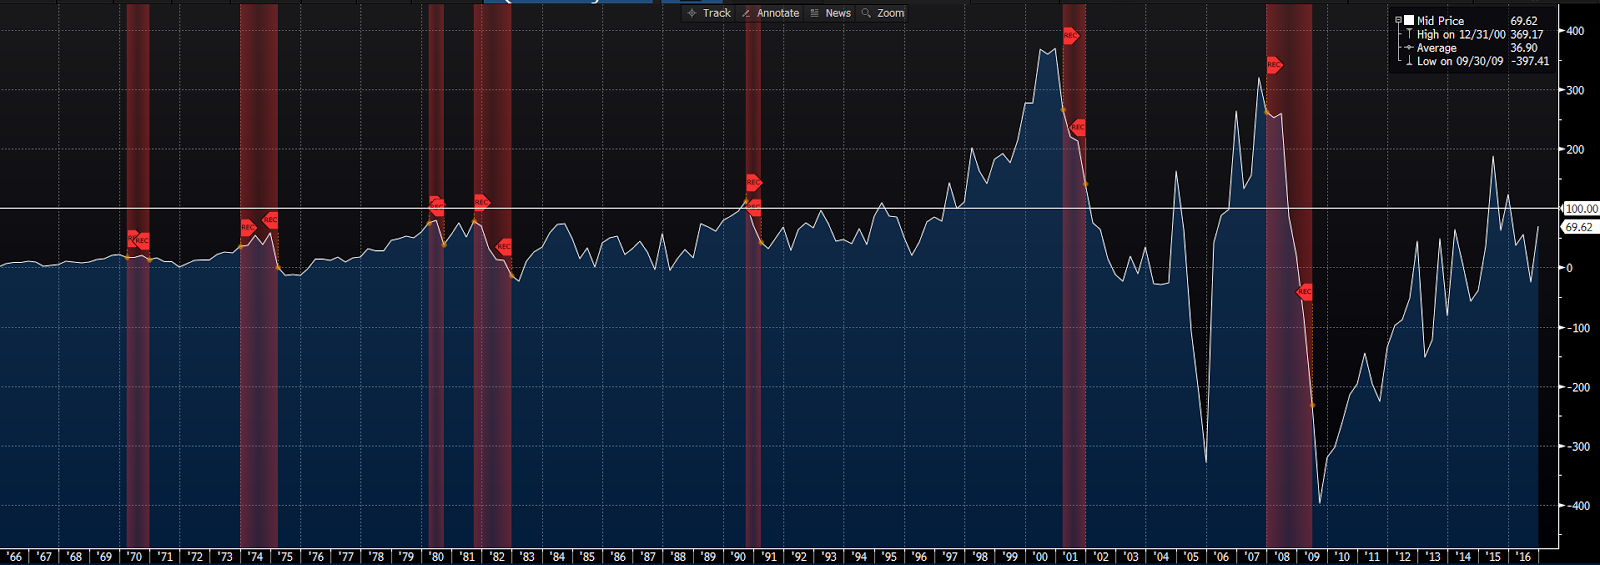
The difference between capital investment and cash flow generation represents the amount of additional capital companies must raise to meet investment needs. The lower the gap the more favorable the corporate positioning. Per the chart, the past two recessions saw the gap expanding markedly going in. The long-term norm is roughly 2% of GDP. At roughly $70 billion, today’s gap looks tame up against the U.S’s $18.5 trillion GDP.
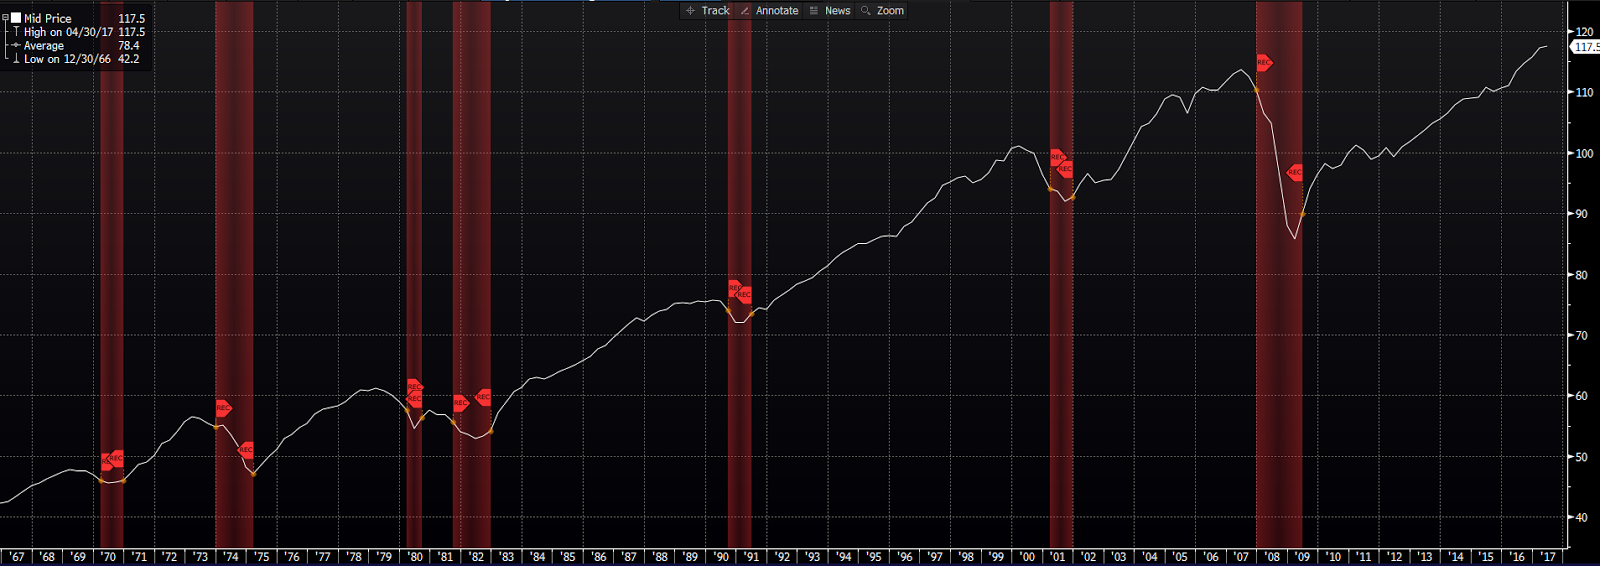
Commercial and Industrial Loans % Change
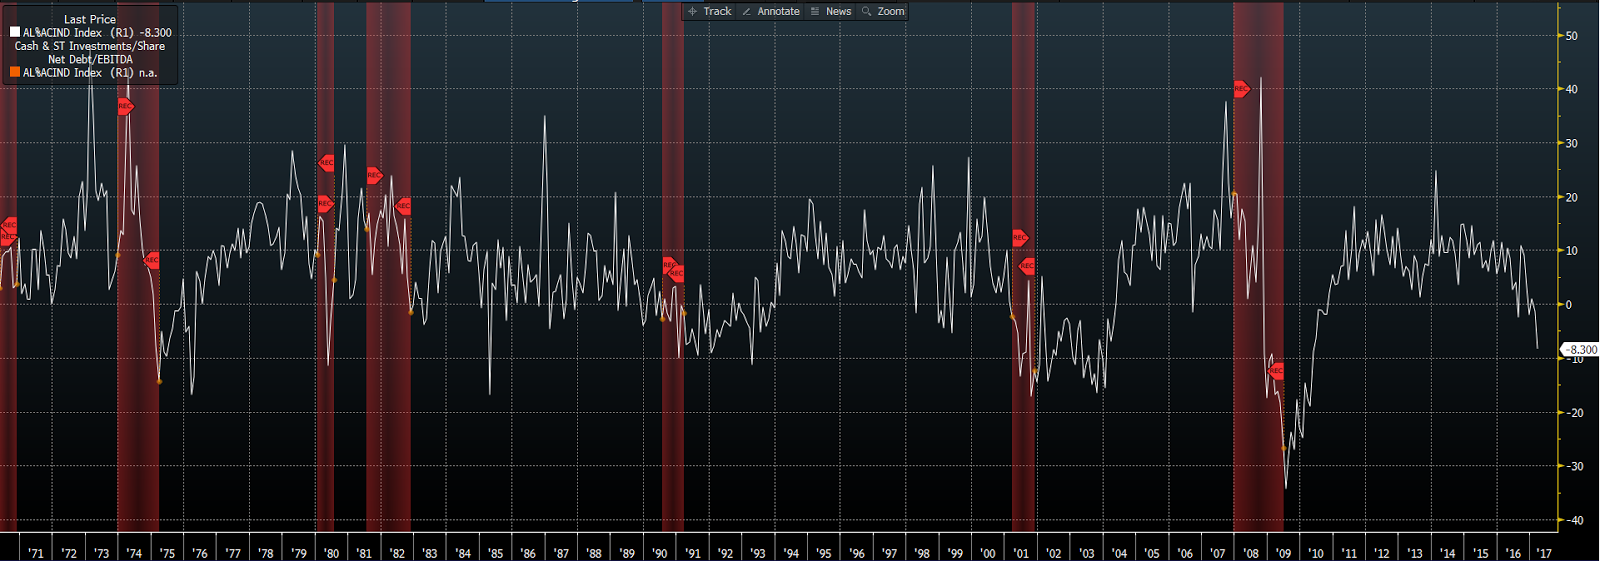
Your typical recession sees a declining trend in business lending on the way in — notwithstanding 2008 (a credit bubble), when we saw a sharp reversal just before the onset of recession. While one might argue that present record cash balances call for less financing, we’ll call it what it is, a marked slowdown in the pace of business lending and, therefore, a red flag to keep an eye on.
Institute for Supply Manage Survey: Manufacturing
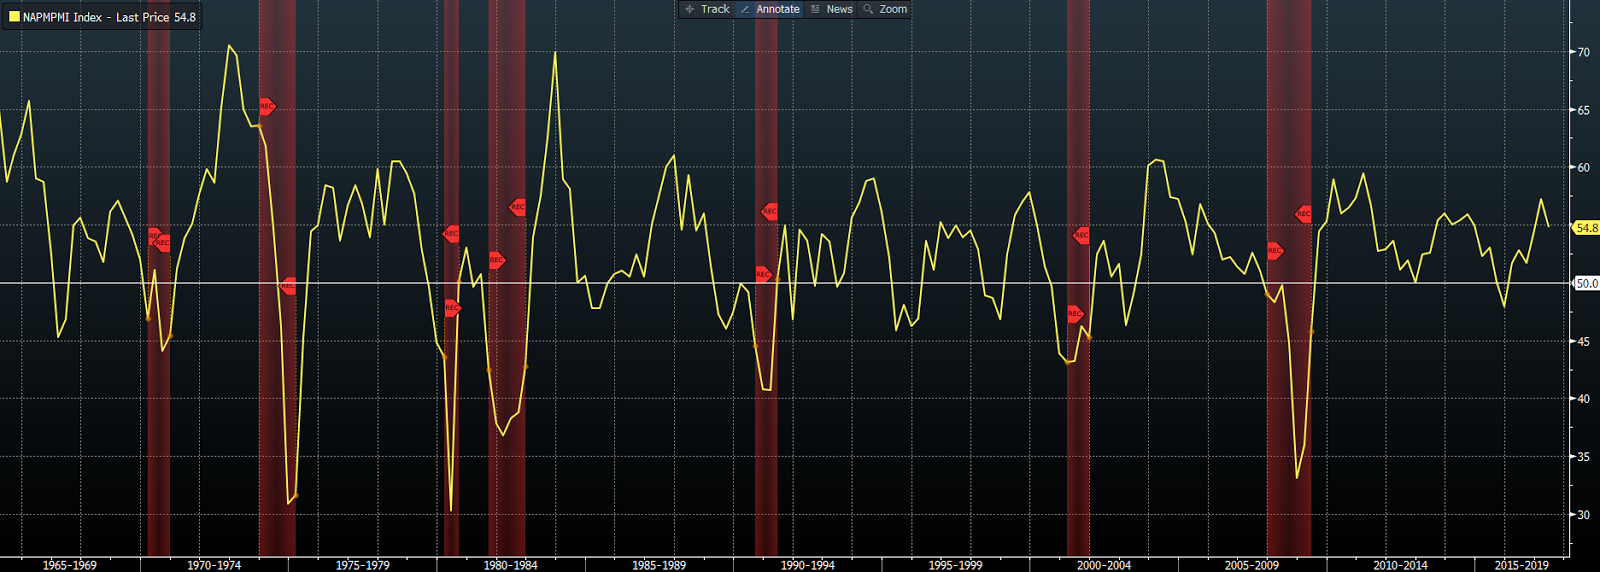
While the latest ISM survey saw purchasing managers slightly less optimistic, the overall score rests comfortably in expansion mode (above 50). My yellow highlight reflects the recent decline.
Institute for Supply Management Survey: Services
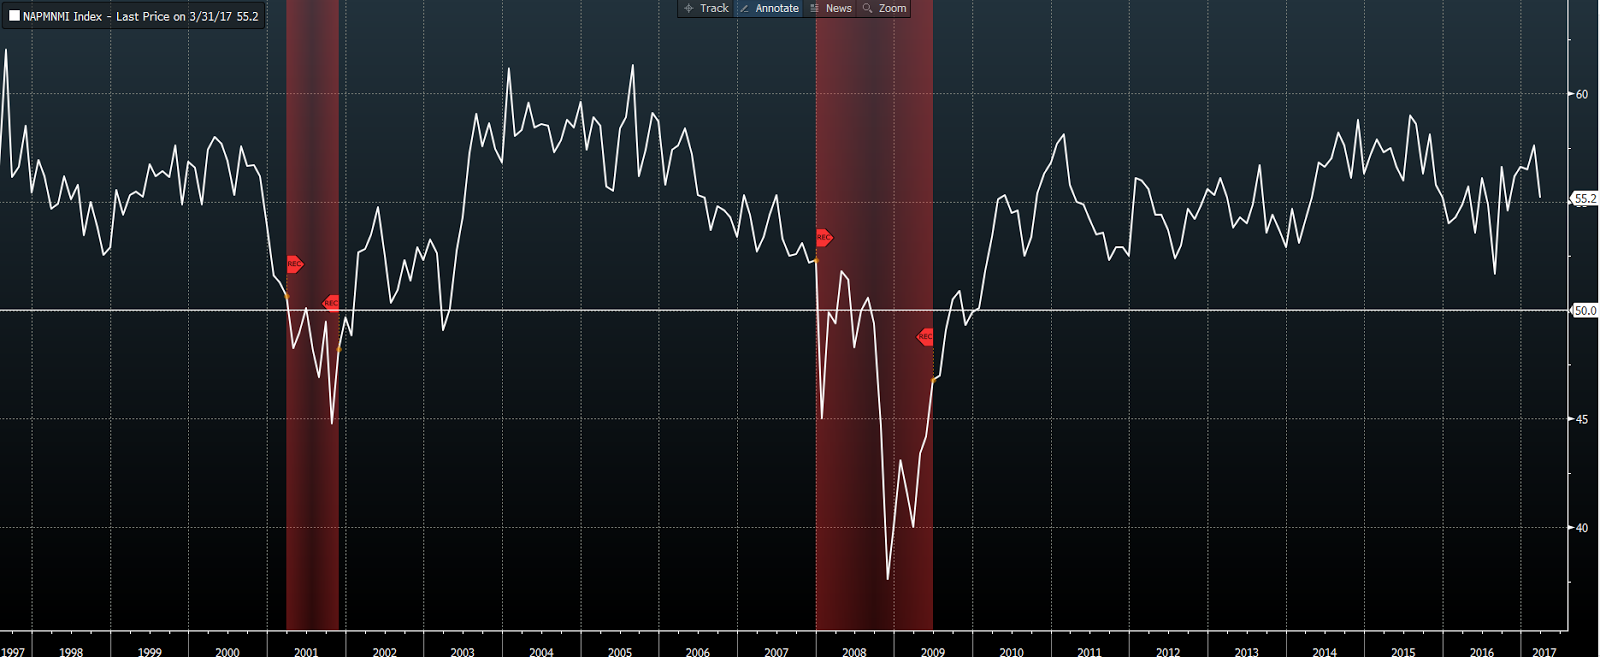
Ditto for the services survey.
The NFIB Small Business Optimism Index
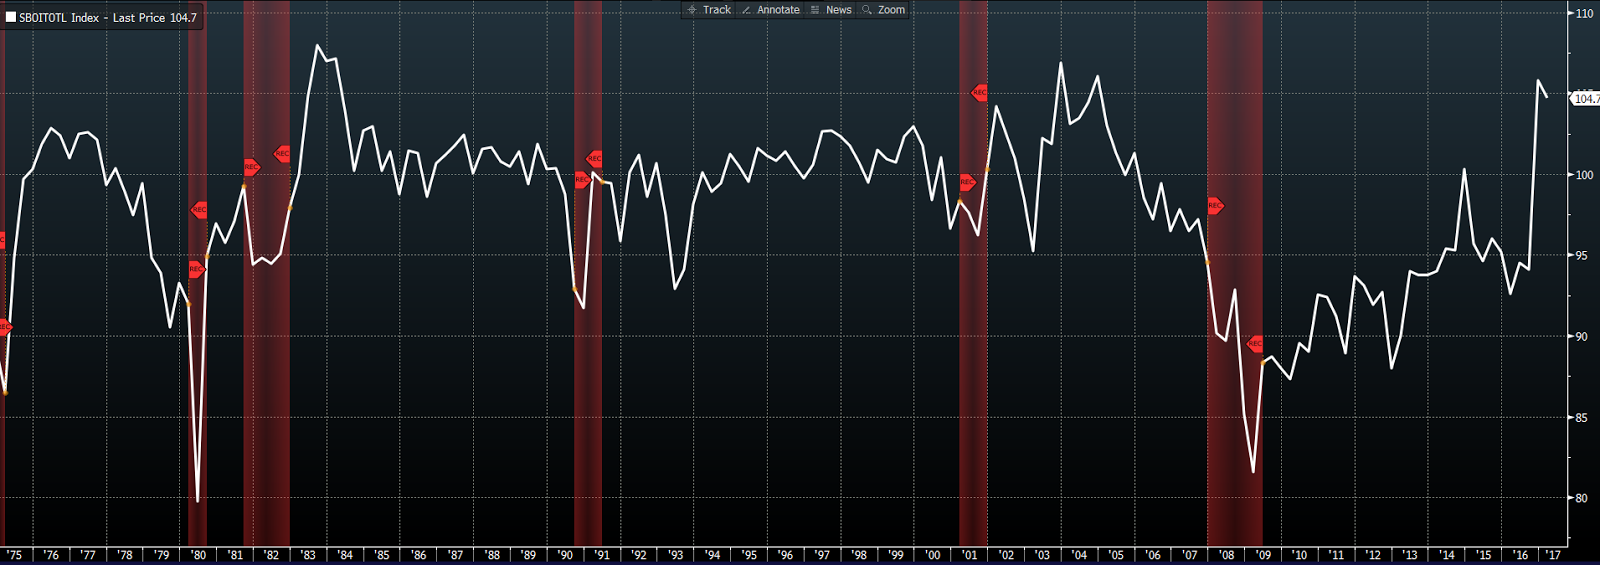
The chart speaks for itself.
NFIB Small Business Hiring Plans
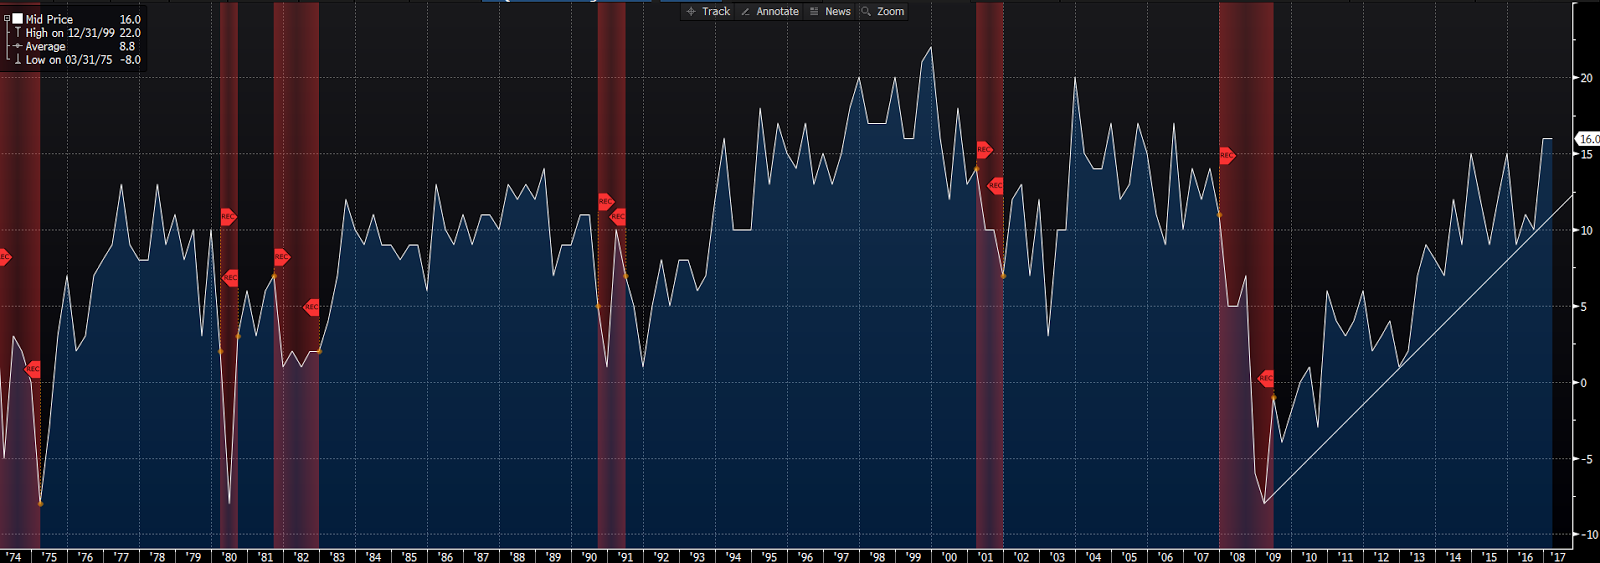
Small business employ nearly 2/3rds of the U.S. working population. Their plans to add to payrolls speak well of the present state of the economy.
NFIB Capex Plans
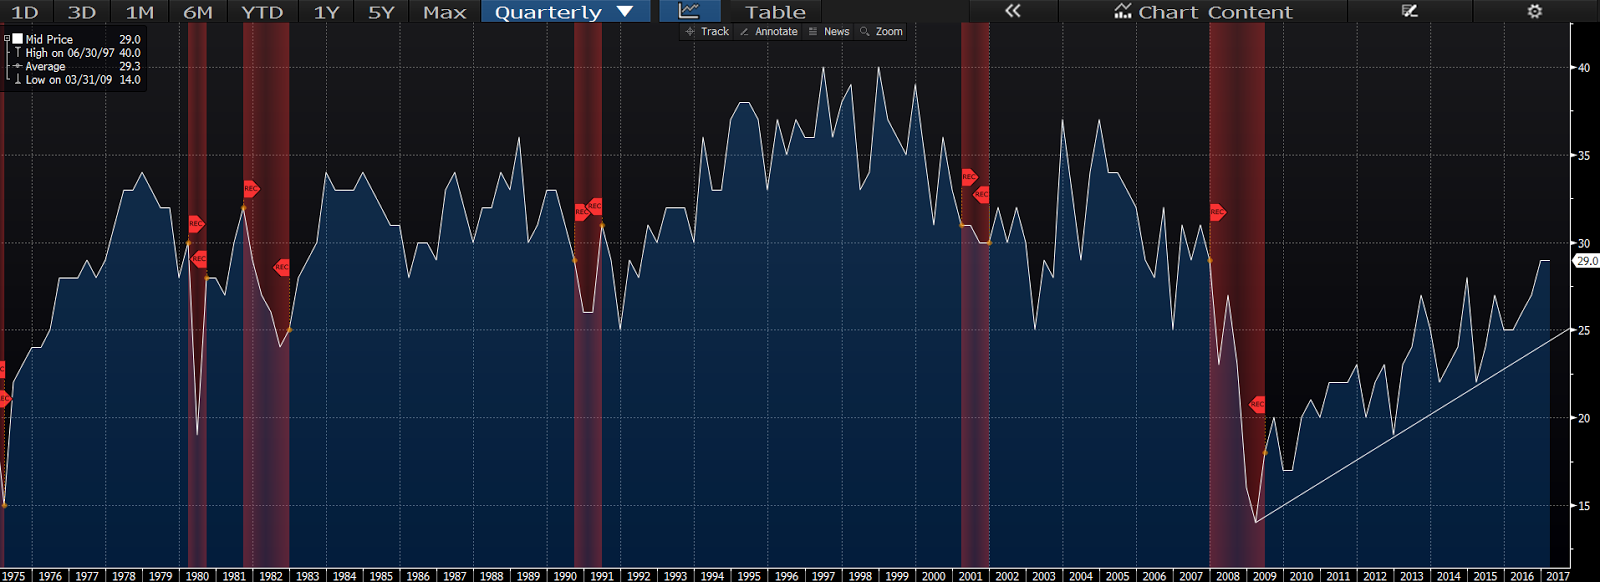
Small businesses are looking to expand.
Truck Tonnage
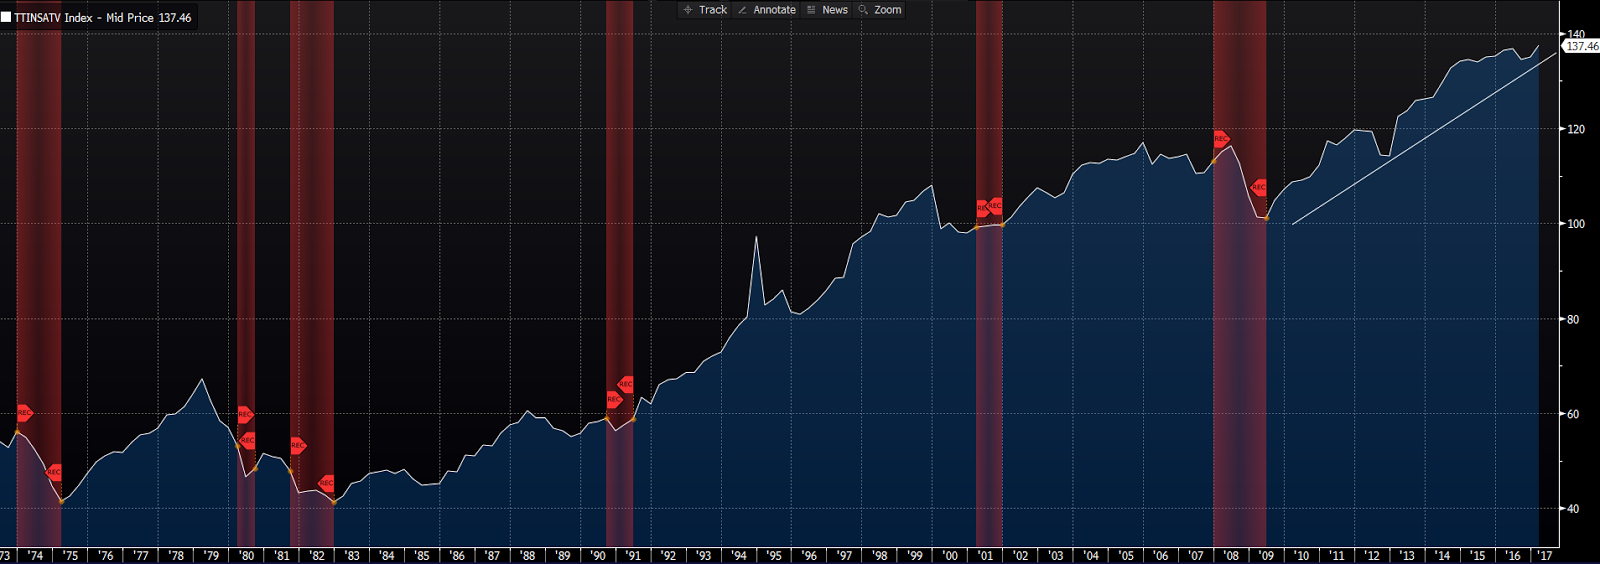
While you may not like the freeway when it’s choked with Mack Trucks, know that it says something very positive about the present state of the economy!
Chemical Activity Index
Chemicals occupy an early position in the supply chain. Therefore, chemical industry data makes for a very good leading indicator of economic activity. Very positive look currently!