

Investors are at ‘maximum optimism’ and have a letdown coming.
My client, we’ll call him Bob (because that’s his name), says:
This thing has to come down. It just can’t keep going up like this.
My other client, we’ll call him Pete (“), says:
Well, in terms of outcome, all three are anticipating the same. Bob and Pete, however — in that their only characterization is that stocks seem high — are, by way of their humility, far wiser in my view than the folks at Goldman. I mean, they’re absolutely right, the market will indeed come down, but they’re humble/wise enough to not even guess at a catalyst. While Goldman is of course correct as well — yes, a letdown is coming — Bob and Pete’s bearish sense of the market flies firmly in the face of its claim that “investors are at maximum optimism”.
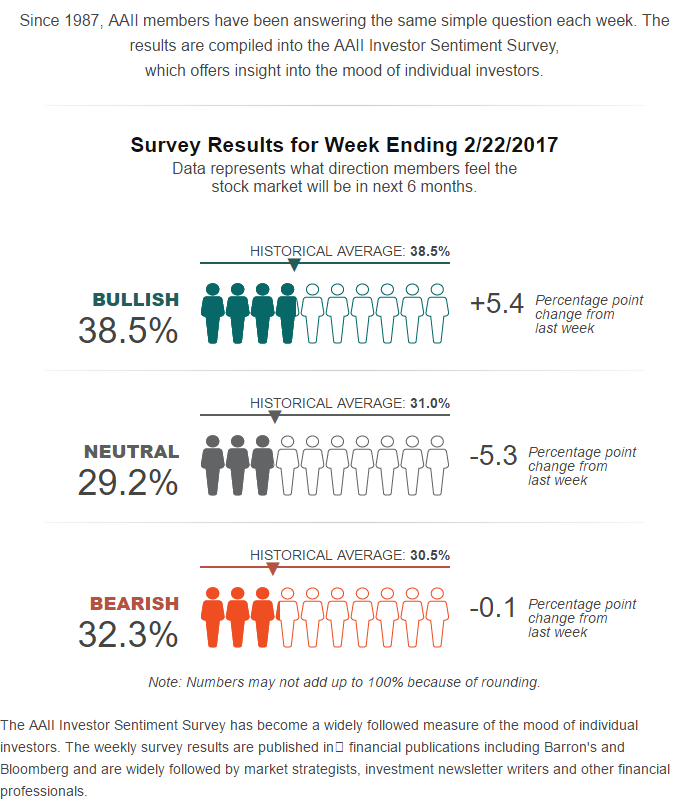
In fact, this week’s American Association of Individual Investors Survey says that folks are bullish exactly to the long-term average extent, and that they’re a little more bearish than usual. Of course that doesn’t jibe with Goldman’s statement either: click charts to enlarge…
So then, if individual investor sentiment is far from “maximum optimism” levels, where’s Goldman coming from? Well, the featured article cites the Investor Intelligence survey of professional investors, which has 62% of the pros firmly in the bull camp. That’s high! I also pay attention to Newsletter Writer sentiment; per the chart below, it (red line)’s high as well:
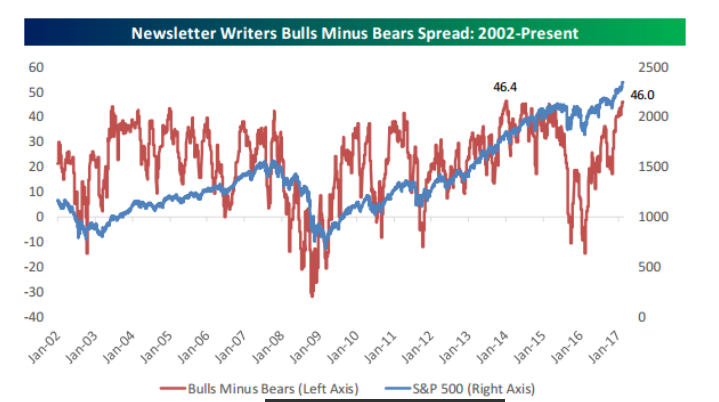
chart courtesy of Bespoke Investment Group
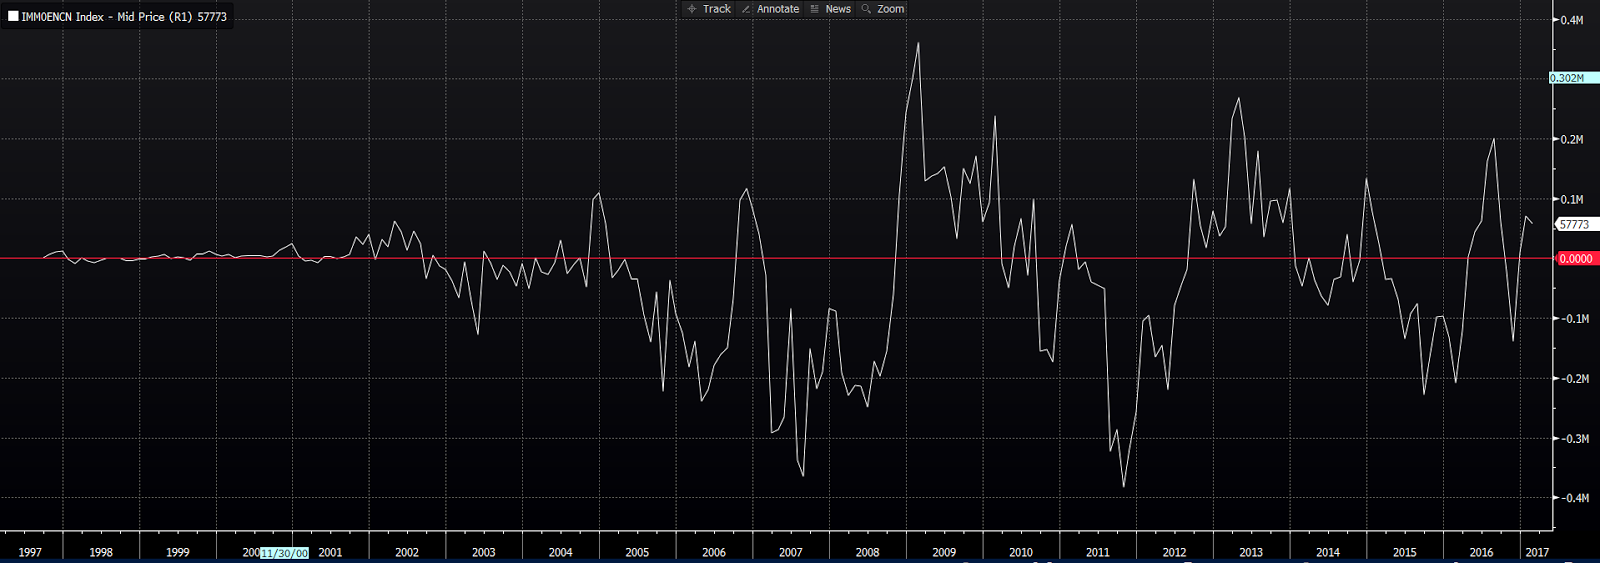
But there’s other stuff I watch too. Like the net positions of the geniuses who trade S&P 500 futures contracts. While they’re net bullish, per the below, they’re not scarily so:
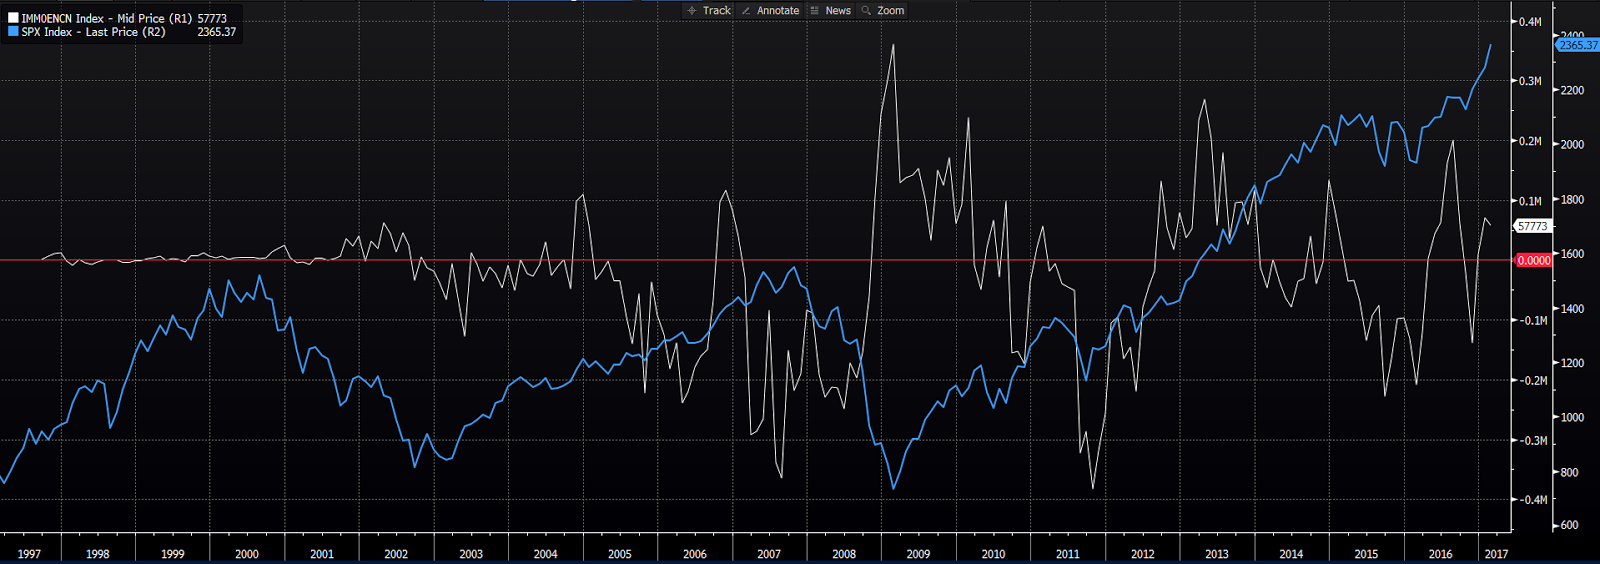
Plus, when we layer on the S&P 500 Index (while there were definitely moments) you have to wonder why all the worry over high optimism among the pros/speculators?
I also track options trading on the S&P 500. With regard to sentiment I watch the ratio of put (betting on a drop) buying to call (betting on a rise) buying. Here’s the put/call ratio’s 20-day moving average over the past 20 years:
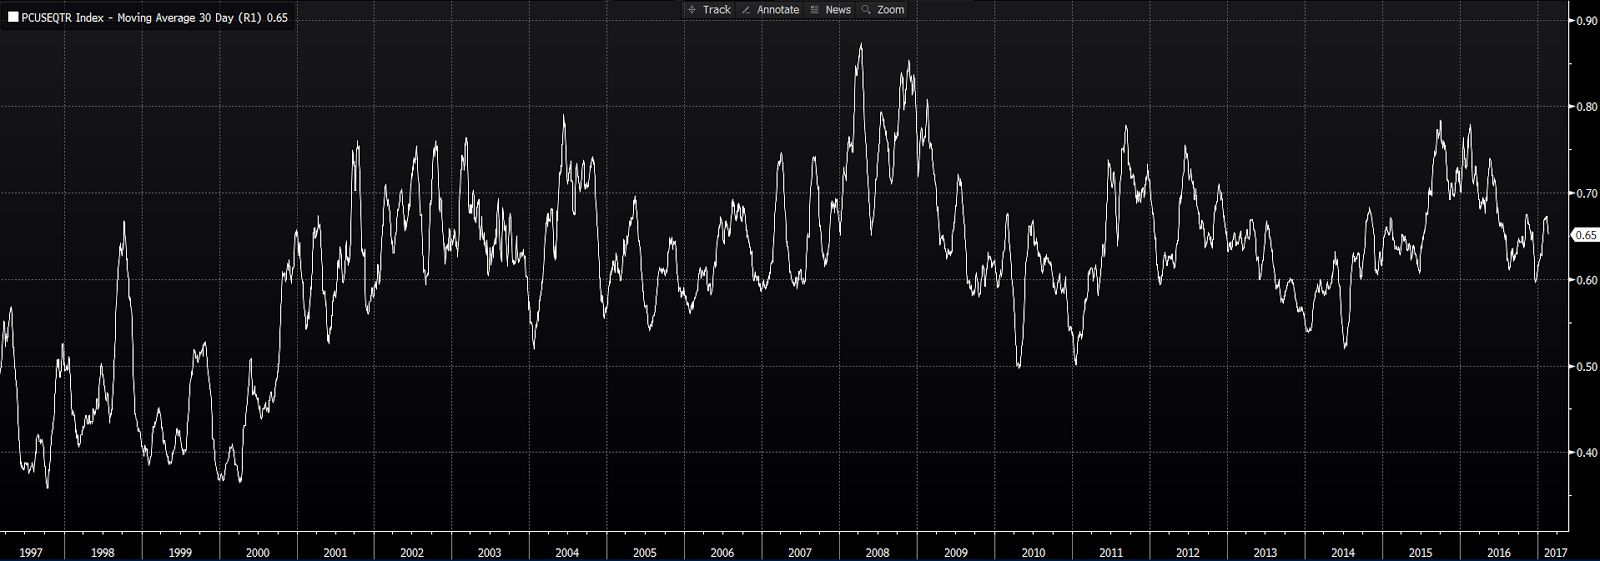
Nothing to get worked up over.
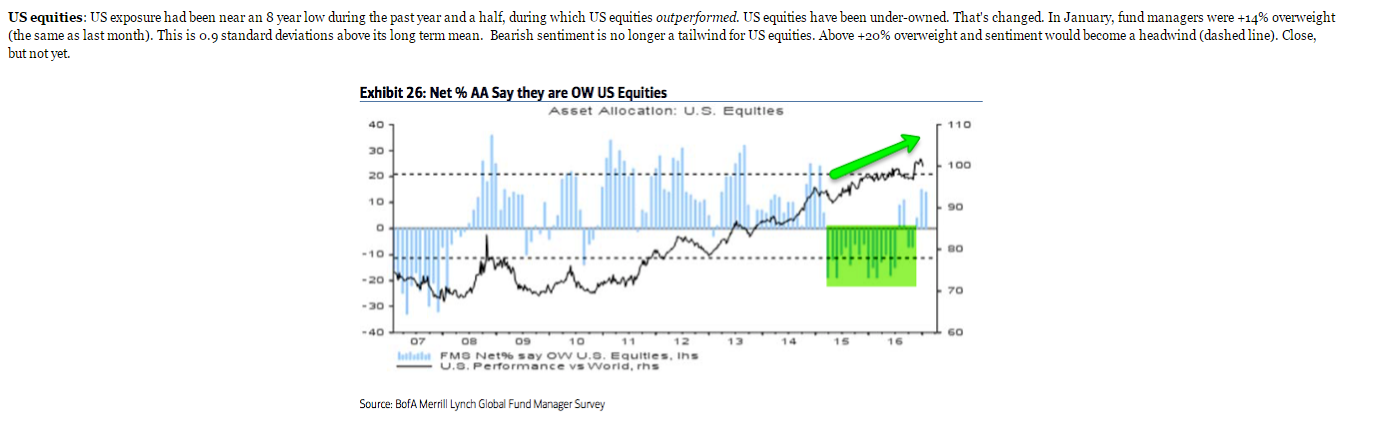
Lastly, we have the positioning of mutual fund managers. And, per the chart below (this one I borrowed), after a pretty good stretch of being under-weight U.S. equities, fund managers (as Goldman suggested) are definitely feeling better about their prospects these days.
Note how the chart’s producer highlighted green (as in it’s a good thing) the recent stretch of under-weightness. Also note how the bars pointing upward (to over-weightness) don’t always denote an under-performing U.S. market:
Now, all that said, I remain sympathetic to John Templeton’s prescient statement:
Bull markets on born on pessimism, grow on skepticism, mature on optimism and die on euphoria.
It’s just that the weight of the evidence doesn’t support Goldman’s assertion that “maximum optimism” is at hand. Plus, as my own research suggests, market-timers would do far better to trade the periods of maximum pessimism.
Here’s from my last month’s blog post on the subject:
Here’s the Dow, along with the 50-day moving average of the bullish readings of the weekly AAII Sentiment Survey (purple), from the day I started my career: click to enlarge…
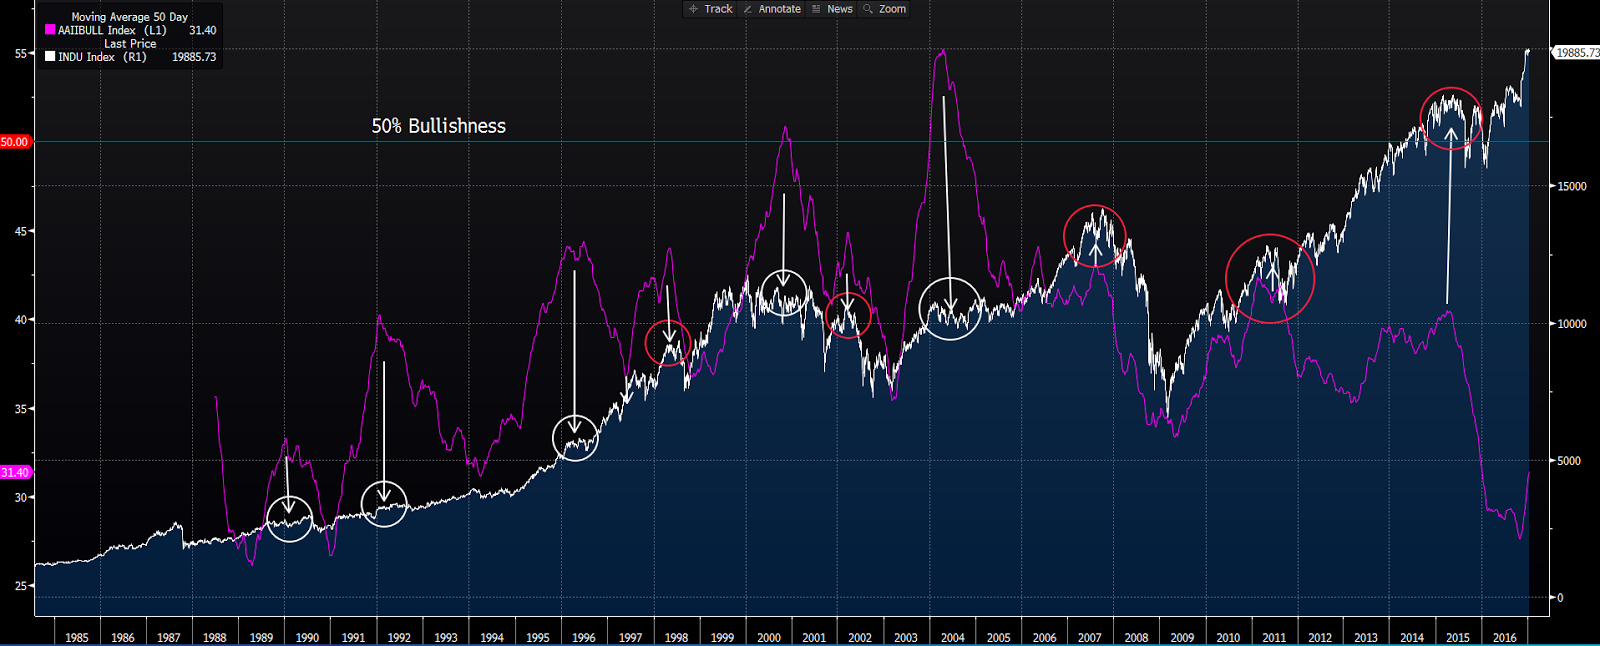
Note the arrows pointing to the Dow right at each peak in bullish sentiment. Clearly, for the long-term investor, playing the contrarian doesn’t always pay — the market turned down shortly after a bullish peak in just 5 of the 10 instances featured. In fact, I can argue that there were just two instances where the reading peaked at a level that would truly be considered highly bullish (above 50%). In the first the market meandered, dipped, then rallied before giving way to the bursting of the tech bubble. The second, the highest, occurred one year into what turned out to be a 4-year bull market. So we’ll say, charitably, that the contrarian was right half the time.
Now wait a second! Take another look at that chart. Look at what the market was doing when the crowd was the least optimistic. Here, I’ll circle the spots on the Dow where average bullishness was hitting its nadirs:
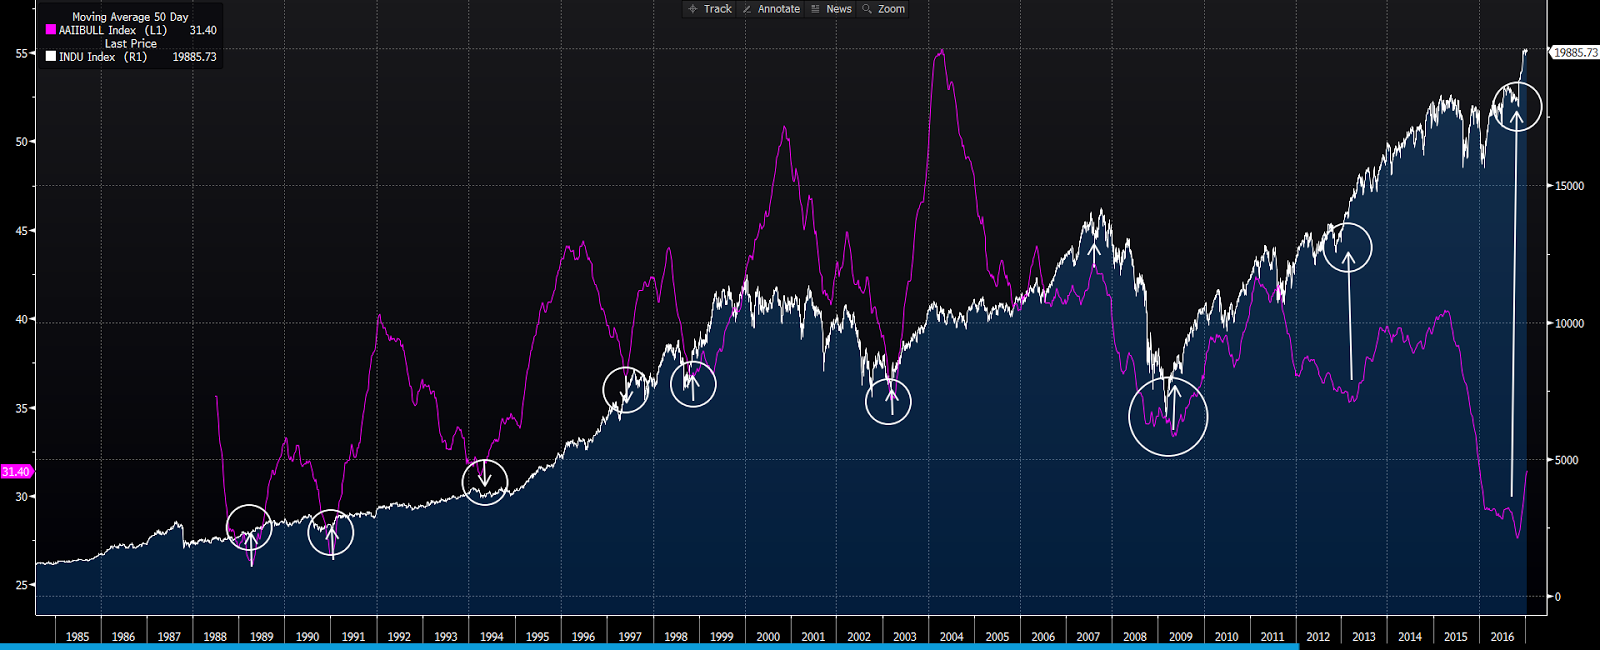
Fascinating! In all nine instances when bullishness was reaching its lows — and yes it was indeed low in those instances (under 40%) — the market was either beginning, or in the midst of, an impressive upward run. So, apparently it does indeed pay to be the contrarian — just more so when the crowd’s the most gloomy.
When it’s all said and done, Goldman, Bob and Pete will each be proven correct; the market is indeed going to drop — that I can absolutely promise! What I can’t promise is when, for how long, or to what extent.
The best we can do is look at probabilities and base our sector allocations accordingly. In case you missed it, here’s yesterday’s video where I talk about the cycle and the market setup. Have a great weekend! Marty