

I’ve been asked a few times lately if, from a trading (as opposed to a long-term investing) perspective, I’d fade this rally. Meaning, at these levels, could a trader make money betting on a fall?
The thing about the market is that it can fall from any height, be it Dow 20,000 or Dow 2,000. And whether it hits that level from above or below doesn’t help us all that much in terms of guessing where it goes from there.
Sure, as you’ve seen in (assuming you watch) the videos, there are short, intermediate and long-term technical indicators that can give us a feel for probabilities going forward. Back-testing those is something we do here regularly.
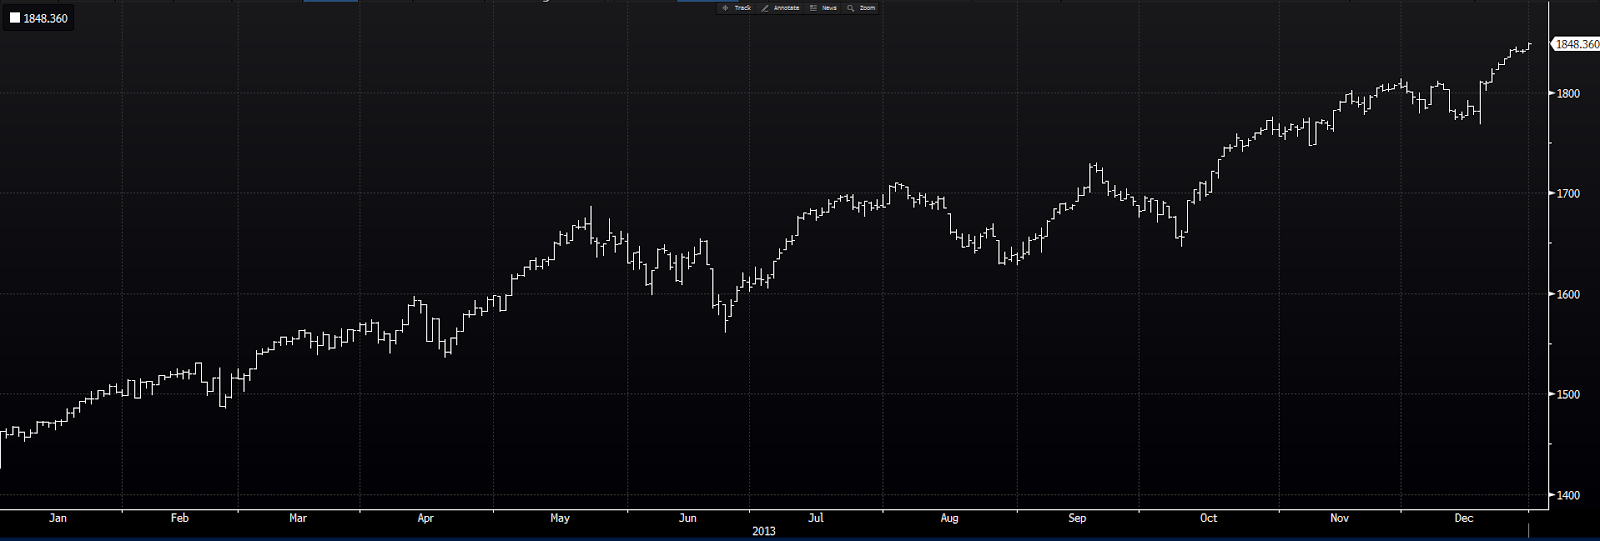
So let’s take a look at 2013, for example: click any chart to enlarge
It was a really good year, with the S&P 500 up nearly 30%:
And for the entire year, the longer-term indicators — like the 100 and 200-day moving averages
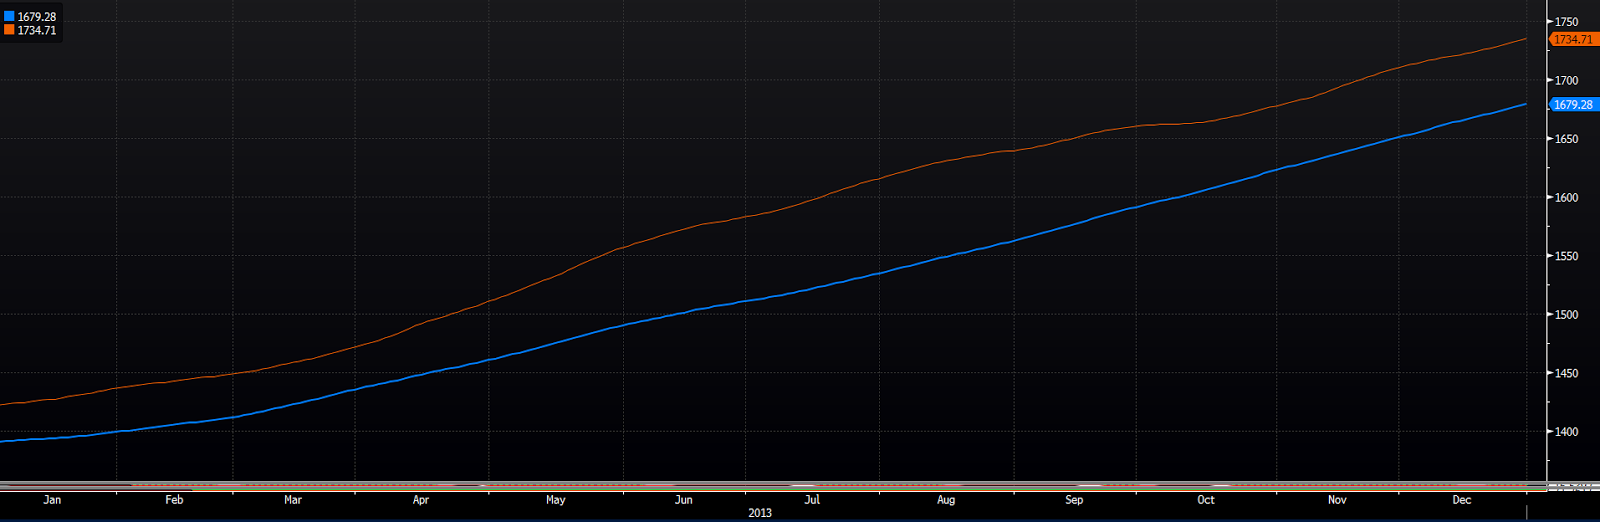
and the monthly MACD —

were confirming the long-term trend.
But what about the short-term indicators? Did they offer anything for the trader in 2013?
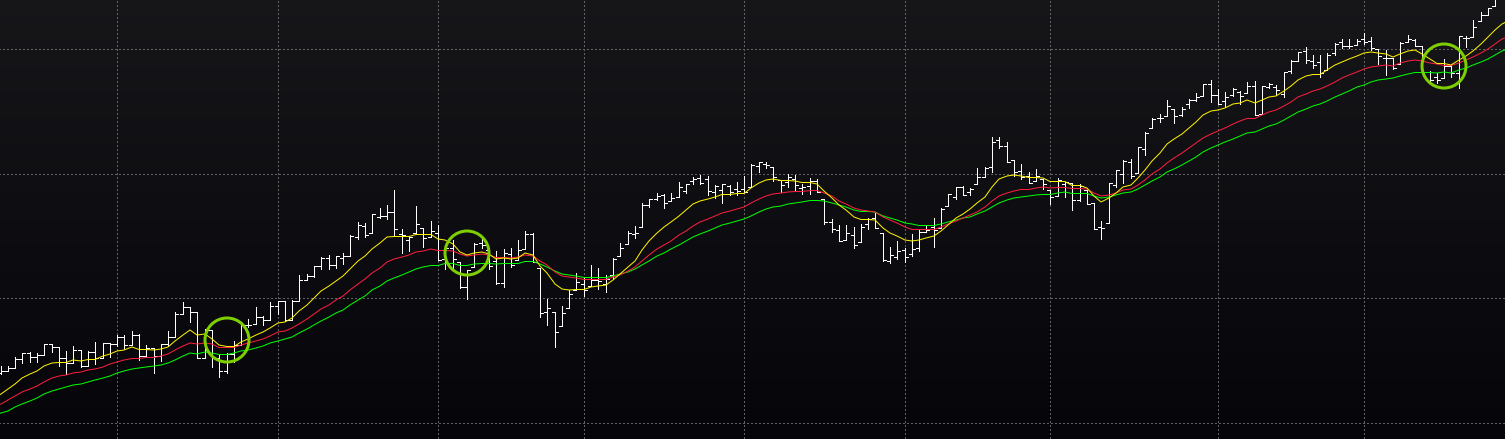
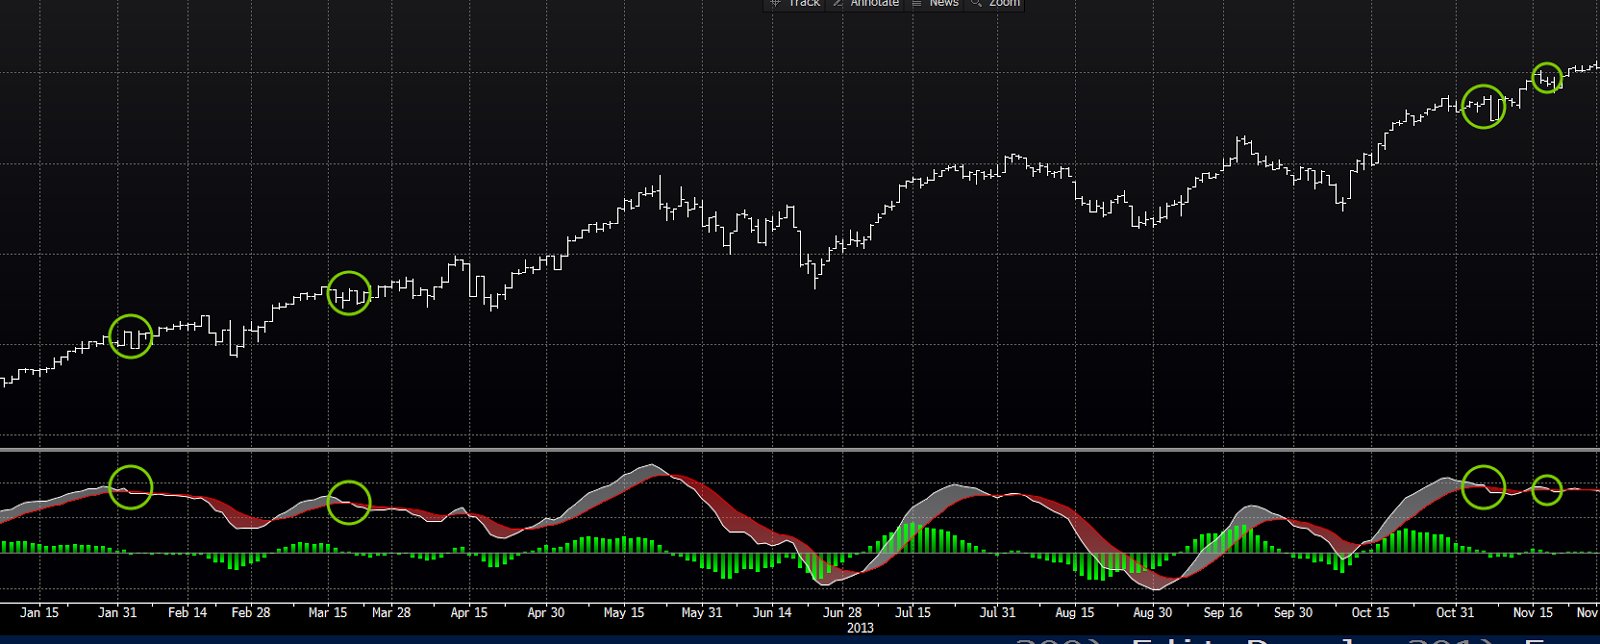
Yes, in fact some did. Here’s a look at the 10, 20 and 30-day exponential (put more emphasis on recent prices) moving averages (EMAs) on the 2013 price chart. I circled the areas where the 10-day EMA broke below the 20 and the 30, which offered a very nice short-term sell signal:
Traders who sold short on those three signals did well, as long as they covered (bought) before the market resumed its march higher.
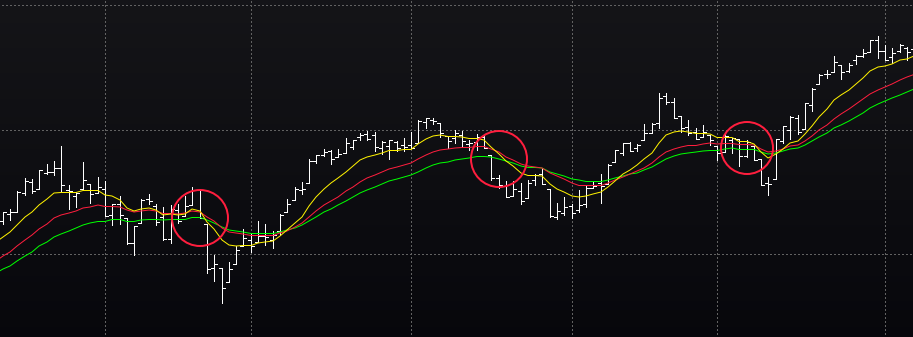
But there were some head fakes along the way. The trader who got antsy and went short when the 10 touched the 20-day EMA got stung — as the market bounced right off of the level where that sell signal was delivered:
So, for the short-term trader, it paid in 2013 to wait for the 10-day EMA to break below the 30 to go short. But, again, only if he/she bought back at the right time.
The daily MACD might’ve helped the short-term trader back in 2013 as well:
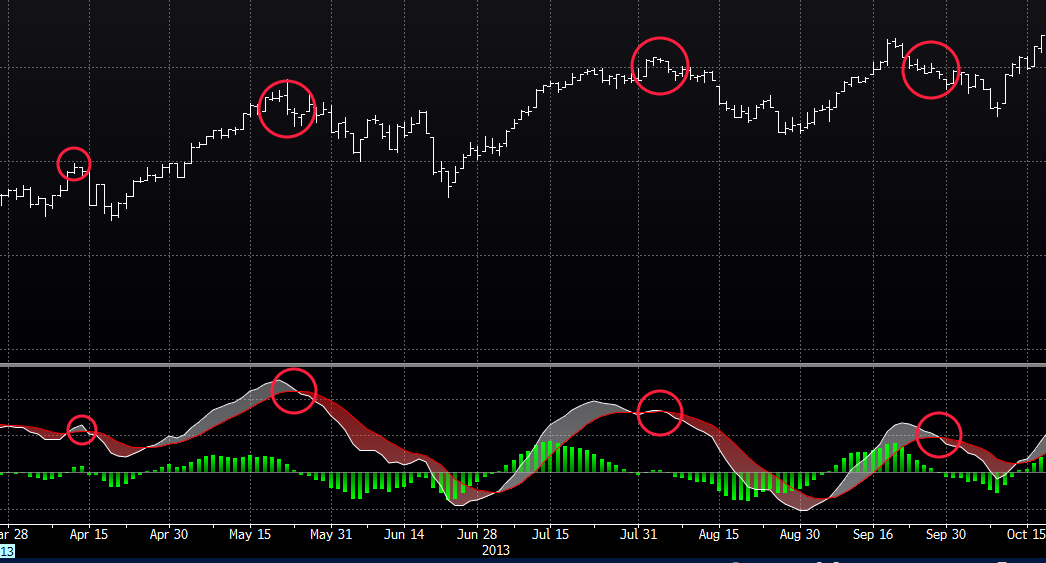
Of course the when-to-buy-back caveat also applies here. Although, the MACD did a decent job helping out (in the above four instances): If you eyeball right where the MACD line (white) rises back above the signal line (red), that’s a buy signal that would’ve had the trader covering at a level lower than where he/she went short.
Ah, but there again, some head fakes:
Alas, there’s no perfect indicator. Which is why this message is not coming to you from my yacht in the Mediterranean. 🙁
Okay, so what about today? Let’s apply the above indicators to a current one-year chart:
Here are the 100 and 200-day moving averages:
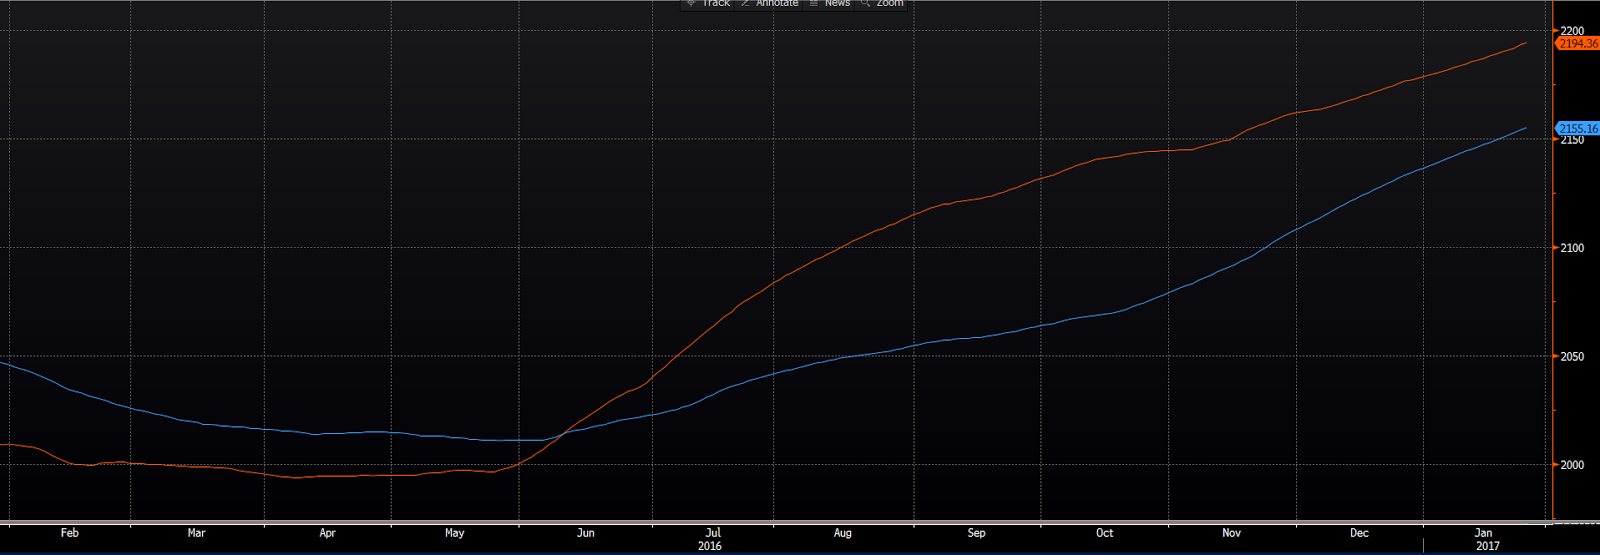
That’s a very good look, with the 100 dma (orange) above the 200, and both with a positive slope.
Here’s the current monthly MACD:
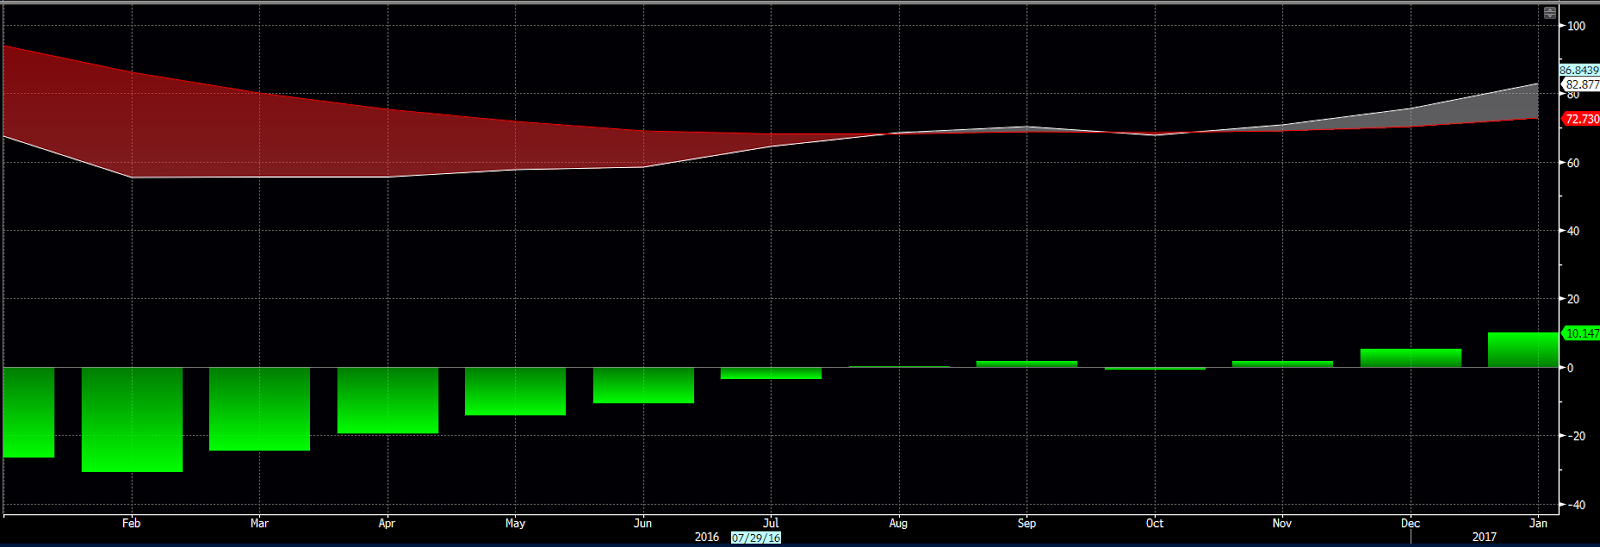
Establishing a new long-term uptrend last fall, and, at the moment, sloping nicely higher.
For the traders, here are those short-term moving averages:
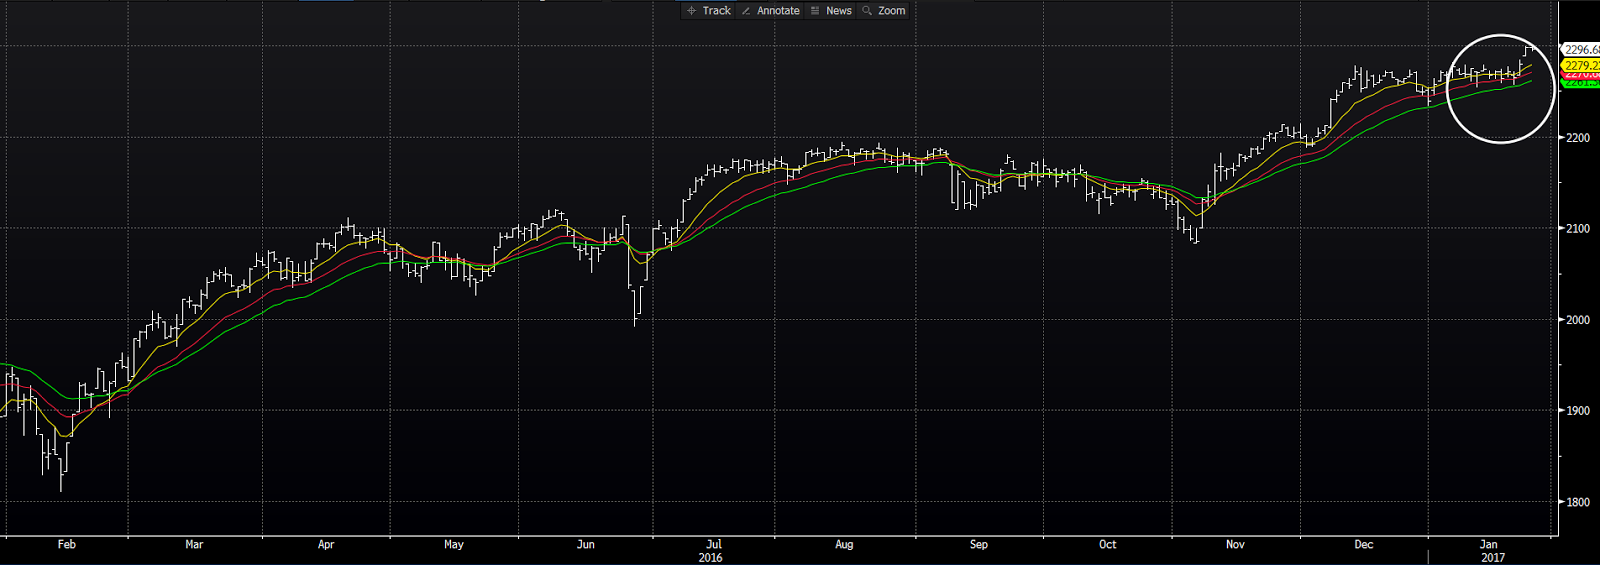
Right now (the circle) they’re lined up the way the bulls want them, and sloping in the right direction.
As for the daily MACD:
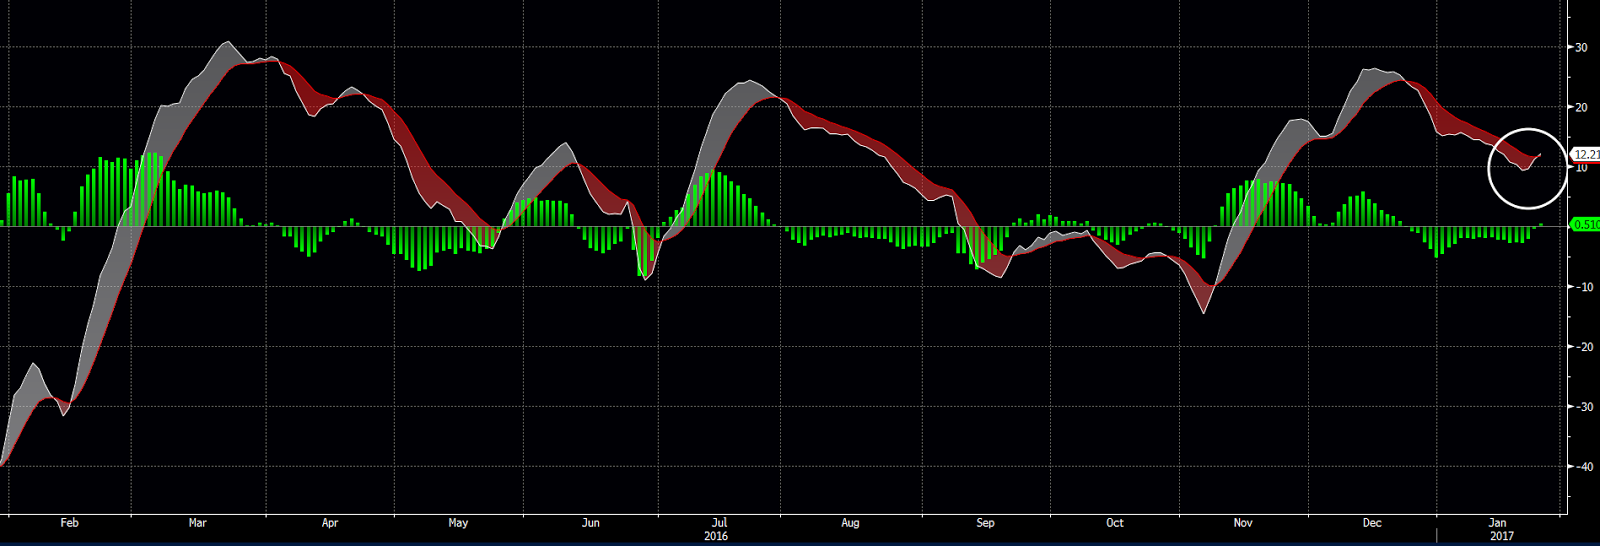
Well, if we had looked at this in late-December — when the MACD line (white) dropped below the signal line (red) — we would’ve had a short-term sell signal. But today (circle), the MACD would tell a short-term trader to buy.
So, to my trader friends who are thinking Dow 20,000 is something to fade; well, I can’t, at the moment, find enough evidence to endorse that tack. Check back tomorrow — the short-term indicators can/will turn very quickly.
For the rest of you, imagine the stress level of the short-term trader!
For the rest of you who are our clients, this is just me helping you keep the short-term in perspective.– because I know you’re listening to the financial news these days. As for us, the managers of your long-term portfolios, the short-term indicators are not something we base our allocation decisions on. Too stressful!
Have a great weekend!
Marty