As clients and regular readers have no doubt gathered, we presently see real long-term opportunity in specific asset classes, sectors and regions of the world.
Now, that said, as we alluded to in Part 3, when it comes specifically to US equities in the aggregate, well… not so much; as the present general setup is, in our view, not one that supports the underlying bullishness that has them (growth stocks in particular) trading at or near their all-time high levels.
Consider, in the context of current general conditions, the questions in this Howard Marks quote featured in our December 23rd morning note, and we suspect you’ll sympathize with our take on the go-forward probabilities for US equities:
“The superior investor is attentive to cycles. He takes note of whether past patterns seem to be repeating, gains a sense for where we stand in the various cycles that matter, and knows those things have implications for his actions. This allows him to make helpful judgments about cycles and where we stand in them. Specifically:
Are we close to the beginning of an upswing, or in the late stages?
If a particular cycle has been rising for a while, has it gone so far that we’re now in dangerous territory?
Does investors’ behavior suggest they’re being driven by greed or by fear?
Do they seem appropriately risk-averse or foolishly risk-tolerant?
Is the market overheated (and overpriced), or is it frigid (and thus cheap) because of what’s been going on cyclically?
Taken together, does our current position in the cycle imply that we should emphasize defensiveness or aggressiveness?”
In Part 3, after illustrating current and historic price-to-sales and price-to-earnings ratios for US growth vs value stocks, and for equities in developed foreign markets vs the S&P 500 Index, we stated the following:
“While there are a number of other valuation metrics we can explore, suffice to say that value stocks presently offer up notable… well… “value” relative to growth stocks.”
And
“Clearly, much like the attractive valuation and income setups with regard to US value over US growth, large cap foreign equities presently possess notable advantages over US large caps.”
With regard to those “other valuation metrics”, we track a total of 5 within the valuation component of our “PWA Equity Market Conditions Index.”
In addition to the two featured in Part 3, we measure:
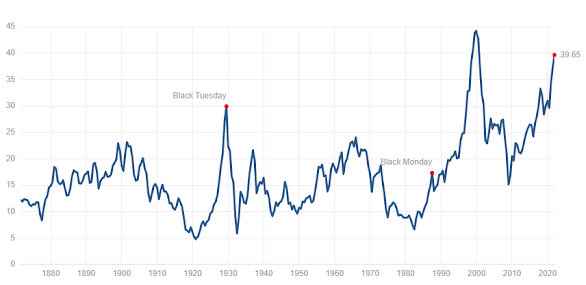
Schiller’s Cyclically Adjusted Price-to-Earnings Ratio (CAPE) for the S&P 500, which, at 39.65, is approaching its breathtaking tech bubble high:
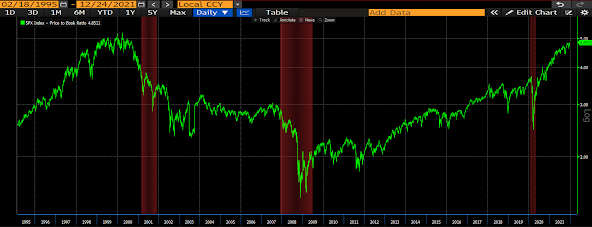
The price-to-book value for the S&P 500, which happens to presently sit just a hair below its tech bubble peak:
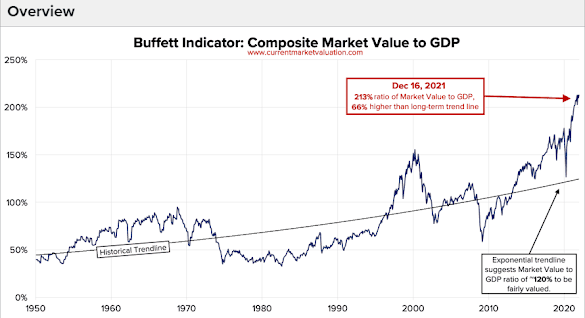
And Warren Buffett’s favorite valuation metric, total US equity market cap to GDP. Which… well… there’s nothing historically close to this indicator’s present “over-valuation” reading:
MC/GDP 216%:
In our December 7 blog post we featured an excerpt from Vanguard Funds’ latest “Market Perspectives” piece. In it they presented their estimates of annual returns for the coming decade for US equities, REITs and foreign equities.
Here are they are:
So, if Vanguard has it right, our migration of late to a US value and foreign equity bias places our clients in very good shape within the equity portion of our core allocation going forward!
In fact, while Vanguard’s outlook (influenced primarily by present valuations) is not encouraging for US equities (growth in particular), macro experts like John Hussman and Jesse Felder — who do some of the deepest work in this space — actually have 10-year projections in the negative for US equities in the aggregate.
Now, about those pockets of opportunities; we’ll expand on those below by offering up brief descriptions of/cases for our top positions (aside from short-term bonds):
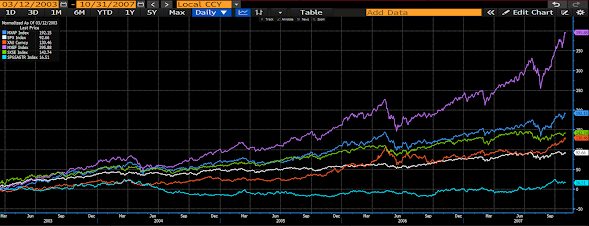
VPL (Asia-Pacific Index ETF): As we’ve illustrated virtually ad nauseam over the past several months, the canyon separating the performance of US equities over the rest of the world since the 2008 financial crisis has been historic.
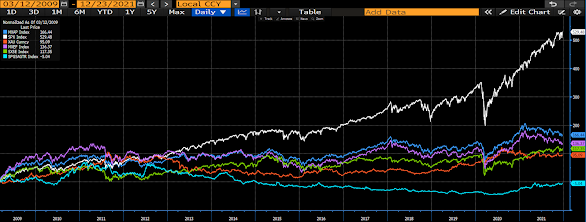
Here’s that familiar chart (the white line is the S&P 500, the rest represent Asia-Pac, Eurozone and Emerging Market equities, gold and agricultural commodity futures (our top 5 positions):
The tendency toward reversion to the mean among intermarket relationships makes a most compelling case for foreign over US equities in the decade ahead.
Note that the above is precisely what played out after the prior bull market (between the tech bubble burst and the real estate bubble peak), where US stocks (white line) notably underperformed all but ag futures:
The purple line, by the way, represents emerging market equities (blue = Asia Pac, green = Eurozone, orange = gold, blue = ag futures)…
Here’s VPL’s country breakdown based on weightings within the portfolio:
Japan 58%
Australia 18%
Korea 13%
Hong Kong 7%
Singapore 3%
New Zealand 1%
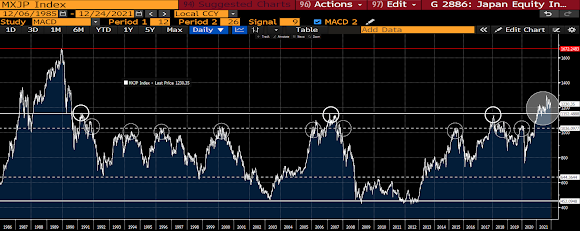
The bullish case for Japan is one of relative valuation, of a new political regime set to deliver strong fiscal support going forward, of being positioned to benefit from a pickup in the economy of their largest export destination — China (we expect easing monetary policy, etc. in China going forward; as its government promises “proactive policy” heading into 2022). And, not to mention, as we’ve illustrated herein, the technical picture* for Japanese equities is long-term compelling.
“…among the top five producers of most of the world’s key mineral commodities, being:
the world’s leading producer of bauxite, alumina, rutile and tantalum
the second largest producer of uranium, lead, ilmenite, zircon and lithium
the third largest producer of iron ore, and zinc
the fourth largest producer of black coal, gold, manganese and nickel and
the fifth largest producer of aluminium, brown coal, diamonds, silver and copper.
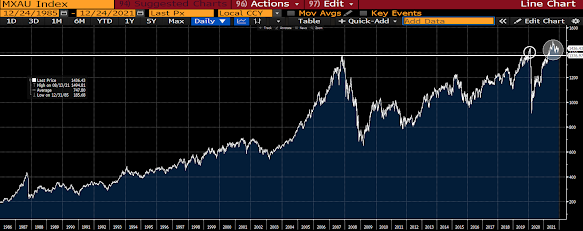
Additionally, Australia is the world’s largest exporter of black coal, iron ore, alumina, lead and zinc and the second largest exporter of uranium.”
Aussie equities’ technicals don’t look long-term shabby either; themselves finally breaking above their 2007 high (after failing to sustain a breakout pre-covid):
FEZ (Eurozone 50 ETF): Per the first two charts under VPL above, the reversion case is made here as well. And suffice to say that if we’ve learned anything over the past few decades, it’s that a massive driving force for developed market equities is the actions of their respective central banks. And, make no mistake, as I type, the Eurozone’s has become the world leader in monetary policy dovishness. At the moment we’d place the Bank of Japan 2nd.
And, as we’ve illustrated, there’s a valuation and yield case that favors the Eurozone over the US as well.
And then there’s the technical setup:
Currently back-testing a breakout above the 2007 high, while still notably off of its 2000 high:
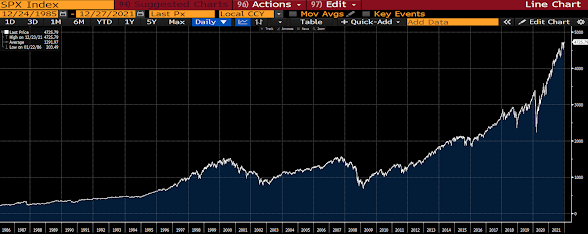
For context, here’s the US S&P 500 Index over the same timeframe:
Oh my!!!
GLD (gold): We have this long-time client who, seems like every time I talk to him about our asset allocation, says to me he still can’t believe that we have a position in gold. He doesn’t recall us ever maintaining a core position in the yellow metal. But indeed we have, although the last time was 1999 (yeah, he goes that far back with us).
All he seems to recall are the times he broached the topic with me over the past several years, only to have me squash the idea based on what I viewed as key missing ingredients in the recipe that would have us owning gold over other positions we deemed more opportune.
Well, recent flatness in its price notwithstanding, we’ve checked off all of the key boxes that say gold is a must-own right here in a smart diversified long-term portfolio.
In a nutshell, gold’s popular appeal has forever been as an inflation hedge. A notion that the historic price action since the Nixon administration was forced to unbind gold’s tie to the dollar in the early 70s more or less supports.
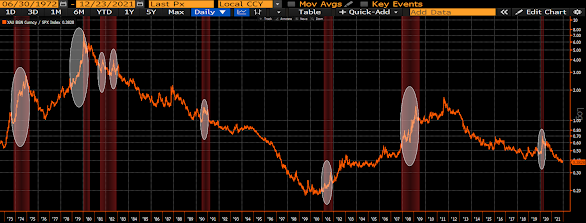
However, gold also holds real appeal when the world’s in deflationary disarray. Per the following chart depicting the recessions (red shaded areas) occurring since Nixon’s abandonment of the gold standard, along with the ratio of gold to US equities (rises when gold outperform stocks, falls when vice versa):
So, yes, indeed, gold is a thing to own if you feel that financial markets are at risk of cracking, or if you feel that inflation will be a thing over the coming years, and agree that large developed-market sovereign debt levels, and asset bubbles, preclude their central banks from consequentially raising rates.
We’ve made what we believe to be a compelling case for the latter, and, while we presently score recession risk low, we’ve illustrated herein that financial markets nevertheless currently run notable risk of the former. And given what we’ll call the present-day economy’s historic leverage against the stock market, the former may, in reflexive action, bring serious recession risk to the fore.
DBA (agricultural commodity futures): Were it not for the heat some of our clients currently catch from their CPAs come tax time (this ETF reports via form K-1), this position would (if not should) be everyone’s favorite!
Notwithstanding its 40% return since we added it last year (up 23.48% this year-to-date), when you consider the prospects for inflation, the potential for a weaker dollar going forward, continued global supply bottlenecks, rising geopolitical risks, and the seemingly never-ending preponderance of surprising and severe weather disruptions these days (not to mention everybody’s gotta eat), having our client portfolios exposed to the price of food makes as much sense as any position we presently have on. Hence its prominent placing in our core allocation…
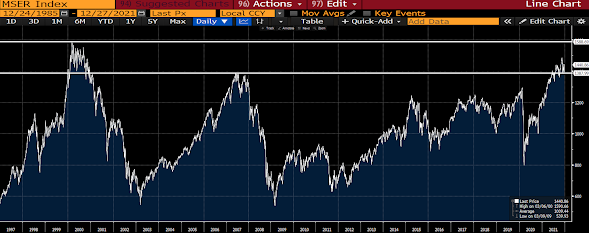
VWO (emerging markets index ETF): Again, we’ve committed sufficient content herein over the past few months to justify our bias toward foreign equities going forward. But when it comes to emerging markets there’s a strong demographic case to be made as well: Some 85% of the world’s humans reside in these emerging economies, they’re on-average notably younger than the folks in the developed world, they have higher birth rates, and so on. Yes, a key ingredient to a growing economy is a rising population!
Aside from the long-term synonymous emerging = growth argument favoring many of these markets, the recent proactive, and appropriate, moves by a number of their central banks to quell inflationary forces (read hiking interest rates), makes them (perhaps counterintuitively) all-the-more attractive to us.
Yes, I pointed out earlier that easy central banks are bullish for stocks — and here I go saying that tightening up on liquidity is bullish. Well, look at it this way, if, as we expect, the rate of inflation cools a bit sometime next year, these appropriately proactive central banks will be in a position to actually ease off of their respective tightening policies (read cut interest rates), which may very well be uber-positive for their respective equity markets, especially coming off of a year of flat to negative results, and amid compelling relative valuation setups.
Contrast that last point with the mess developed market central banks have gotten themselves into. I.e., at zero, or negative, interest rates, they’ve severely hamstrung themselves; leaving essentially money printing (that’s inflationary in the present environment!) as their last lever for stimulating their respective economies.
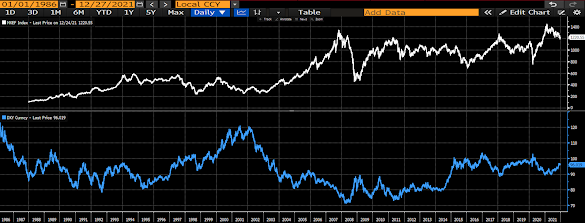
Lastly if you’re looking for a compelling way to play the potential for a long-term weaker US dollar, along with commodities, emerging market equities can be huge!
Top panel MSCI Emerging Market Index, bottom US Dollar Index, 1986 to current:
SLV (silver): Simply put, silver captures a bit of the precious metal trade, while being an important industrial metal as well (although we fundamentally place little weight on the former; so we’ll dispense with the gold/silver ratio argument that some believe presently makes a case for silver)
I suspect that most interested individuals are by now familiar with silver’s key (essential) application with regard to solar technology. That, on its own, makes for a bullish case. We’re not sure, however, to what extent folks are aware of silver’s application in 5G.
“5G is not just an incremental improvement over 4G — it is the next major evolution of mobile communication technology. It will massively improve download speeds and reduce latency, but more importantly, it will facilitate significant technological progress in a whole range of sectors, such as the Internet of Things (IOT) and autonomous driving.
The electronic components that enable 5G technology will rely heavily on silver to ensure that the global 5G platform performs seamlessly. In a future 5G-connected world, silver will be a necessary component in almost all aspects of this technology, resulting in yet another end-use for silver in an already vast and versatile demand portfolio.
At present, 5G deployment is still in its early stages and, as such, 5G-related silver demand currently constitutes approximately 7.5 million ounces (Moz). With the rollout of 5G in the coming years, however, silver’s role in the electronic applications used in 5G is forecast to rise significantly to approximately 16 Moz by 2025 and as much as 23 Moz by 2030, which would represent a 206 percent increase over today. For comparison purposes: in 2010, silver’s use in the once-emerging photovoltaic industry was approximately 40 Moz, and by 2018 it stood at 80.5 Moz.”
If by now you’re beginning to think that we’re ignoring US equities altogether, that’s definitely not the case. It’s just that we express our US exposure by breaking it down by sector, and individual securities, as opposed to investing in the trackers of the major diversified indices. Altogether US equities account for roughly half of our exposure to stocks, as we’ll explore in Part 5…
Attention non-client subscribers, a reminder: Nothing on the blog should be construed as investment advice. The examples expressed relate to portfolio management we perform on behalf of our clients, and, again, under no circumstances are they to be considered recommendations to the reader.